The Role of National Exam
For the longest time, national exam, like many other countries in the world is used as one of the metric to measure how well our future would be (re: children). The concept is simple, each and every children in the country will be given a set of questions/ tasks, that has to be completed for a given time, on different subjects (likely to be Math, Language, Science).

In Indonesia, this was used to be the sole metric to say if one student passed the exam or not. This has been changed ever since the newly appointed education minister of Indonesia, Nadiem Makarim (also the co-founder of SE Asia Decacorn- Gojek, Now GoTo). Nevertheless, it is interesting to see how this metric pan out over the course of 2015-2019, to see if the decentralized quality of education still persist in Java, Bali and its surrounding only. Leaving out Kalimantan, Sulawesi, Sumatra, NTT, and Papua.
Data Gathering
Webscraping using Pandas
We’re taking a look on the data from Ministry of Education (Kemendikbud), from 2019 on national exams as follows.
For this use we will need to scrape the data from the website, but the catch is–we are using just pandas library!
Enter pandas.read_html()
Show Code
| No. | Kode Wilayah | Nama Wilayah | Propinsi | Persentase Anggaran Pendidikan tanpa Transfer Daerah (%) | UN SMP | UN SMA IPA | UN SMA IPS | UN SMA BAHASA | UN SMK | IIUN SMP | IIUN SMA IPA | IIUN SMA IPS | IIUN SMA BAHASA | IIUN SMK | |
|---|---|---|---|---|---|---|---|---|---|---|---|---|---|---|---|
| 0 | 1 | 010000 | Prov. D.K.I. Jakarta | Prov. D.K.I. Jakarta | 18.96 | 62.17 | 67.99 | 63.75 | 0 | 51.41 | 100 | 100 | 100 | 0 | 100 |
| 1 | 2 | 010100 | Kab. Kepulauan Seribu | Prov. D.K.I. Jakarta | 0.00 | 45.26 | 0 | 0 | 0 | 0 | 100 | 0 | 0 | 0 | 0 |
| 2 | 3 | 016000 | Kota Jakarta Pusat | Prov. D.K.I. Jakarta | 0.00 | 60.97 | 69.43 | 64.01 | 0 | 55.13 | 100 | 100 | 100 | 0 | 100 |
| 3 | 4 | 016100 | Kota Jakarta Utara | Prov. D.K.I. Jakarta | 0.00 | 60.09 | 66.59 | 61.53 | 0 | 48.85 | 100 | 100 | 100 | 0 | 100 |
| 4 | 5 | 016200 | Kota Jakarta Barat | Prov. D.K.I. Jakarta | 0.00 | 60.42 | 69.31 | 63.85 | 0 | 49.65 | 100 | 100 | 100 | 0 | 100 |
Let’s see what features do we have, and which one do we really care about in this project.
Index(['No.', 'Kode Wilayah', 'Nama Wilayah', 'Propinsi',
       'Persentase Anggaran Pendidikan tanpa Transfer Daerah (%)', 'UN SMP',
       'UN SMA IPA', 'UN SMA IPS', 'UN SMA BAHASA', 'UN SMK', 'IIUN SMP',
       'IIUN SMA IPA', 'IIUN SMA IPS', 'IIUN SMA BAHASA', 'IIUN SMK'],
      dtype='object')
We will leave some columns and just using region information (‘Nama Wilayah’, ‘Propinsi’), and national exams score (‘UN SMP’,‘UN SMA IPA’, ‘UN SMA IPS’)
Show Code
| Nama Wilayah | Propinsi | UN SMP | UN SMA IPA | UN SMA IPS | |
|---|---|---|---|---|---|
| 0 | Prov. D.K.I. Jakarta | Prov. D.K.I. Jakarta | 62.17 | 67.99 | 63.75 |
| 1 | Kab. Kepulauan Seribu | Prov. D.K.I. Jakarta | 45.26 | 0 | 0 |
| 2 | Kota Jakarta Pusat | Prov. D.K.I. Jakarta | 60.97 | 69.43 | 64.01 |
| 3 | Kota Jakarta Utara | Prov. D.K.I. Jakarta | 60.09 | 66.59 | 61.53 |
| 4 | Kota Jakarta Barat | Prov. D.K.I. Jakarta | 60.42 | 69.31 | 63.85 |
Let’s also check if the dtypes is already correct e.g. digit would be float64 or int64 dtype.
<class 'pandas.core.frame.DataFrame'>
RangeIndex: 547 entries, 0 to 546
Data columns (total 5 columns):
 #   Column        Non-Null Count  Dtype
---  ------        --------------  -----
 0   Nama Wilayah  547 non-null    object
 1   Propinsi      547 non-null    object
 2   UN SMP        547 non-null    object
 3   UN SMA IPA    547 non-null    object
 4   UN SMA IPS    547 non-null    object
dtypes: object(5)
memory usage: 21.5+ KB
Let’s make some amendments on dtypes, to allow plotting.
Show Code
Nama Wilayah     object
Propinsi         object
UN SMP          float64
UN SMA IPA      float64
UN SMA IPS      float64
dtype: object
Just me, but I dont like redundant information, so let’s remove some of the words in the column.
| Wilayah | Propinsi | UN SMP | UN SMA IPA | UN SMA IPS | |
|---|---|---|---|---|---|
| 0 | Prov. D.K.I. Jakarta | Prov. D.K.I. Jakarta | 62.17 | 67.99 | 63.75 |
| 1 | Kab. Kepulauan Seribu | Prov. D.K.I. Jakarta | 45.26 | 0.00 | 0.00 |
| 2 | Kota Jakarta Pusat | Prov. D.K.I. Jakarta | 60.97 | 69.43 | 64.01 |
| 3 | Kota Jakarta Utara | Prov. D.K.I. Jakarta | 60.09 | 66.59 | 61.53 |
| 4 | Kota Jakarta Barat | Prov. D.K.I. Jakarta | 60.42 | 69.31 | 63.85 |
Similarly, let’s remove ‘Prov’ from each data in ‘Propinsi’ column.
Show Code
| Wilayah | Propinsi | UN SMP | UN SMA IPA | UN SMA IPS | |
|---|---|---|---|---|---|
| 0 | Prov. D.K.I. Jakarta | D.K.I. Jakarta | 62.17 | 67.99 | 63.75 |
| 1 | Kab. Kepulauan Seribu | D.K.I. Jakarta | 45.26 | 0.00 | 0.00 |
| 2 | Kota Jakarta Pusat | D.K.I. Jakarta | 60.97 | 69.43 | 64.01 |
| 3 | Kota Jakarta Utara | D.K.I. Jakarta | 60.09 | 66.59 | 61.53 |
| 4 | Kota Jakarta Barat | D.K.I. Jakarta | 60.42 | 69.31 | 63.85 |
Quick DataViz…
Let’s plot senior high school (SMA) data:
Show Code
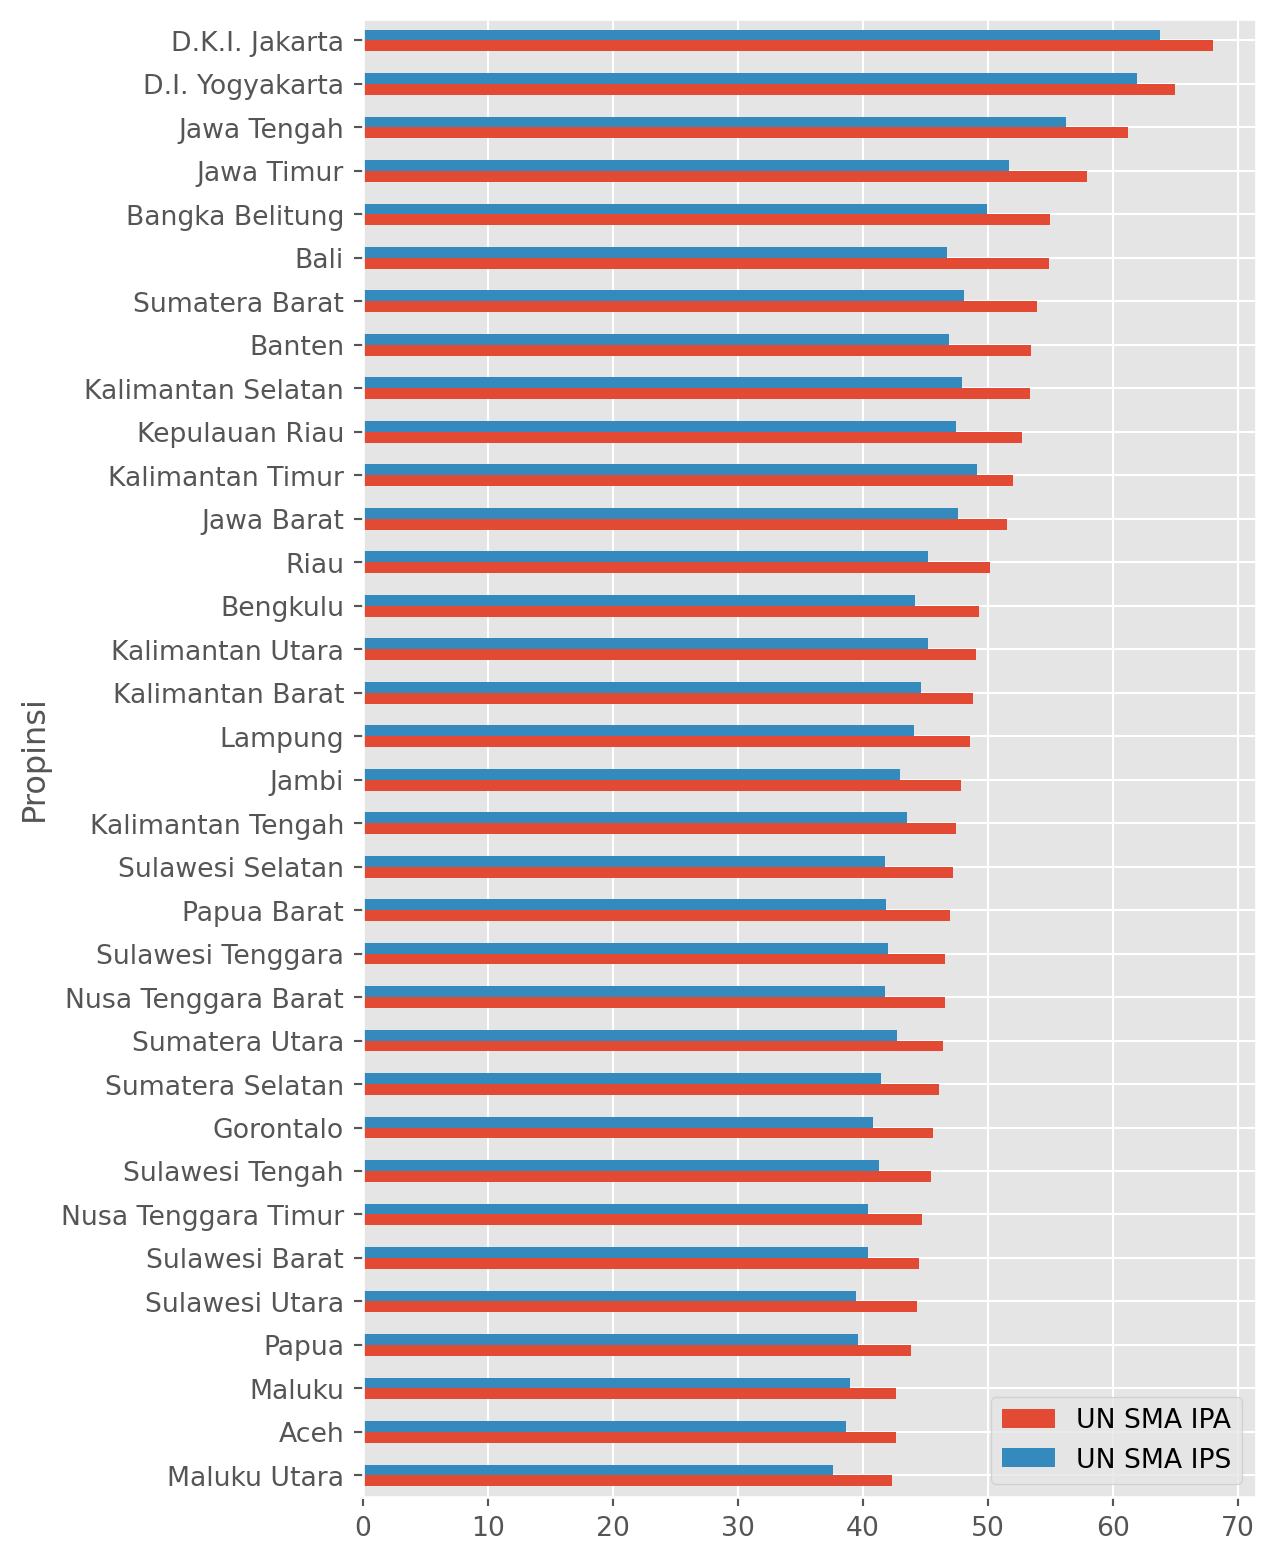
So, from the look of it, 2019 seems to be the year of our capital city: D.K.I. Jakarta, followed by Yogyakarta, Jawa Tengah, Timur, Bali etc. Excluding Bangka Belitung, the big five is all from Java and Bali.
Decentralized? From 2019- YES.
But of course this won’t do it justice, we need more data right?
Scrape More Data
Let’s all be human, not abusive towards our notebook, and create a function to scrape our data-change the dtypes-change the column name etc.
Show Code
def webscrap(tahun):
    df = pd.read_html(f'https://npd.kemdikbud.go.id/?appid=hasilun&tahun={tahun}')[1][0:547] #ambil data dari web
    df = df[['Nama Wilayah', 'Propinsi', 'UN SMP','UN SMA IPA', 'UN SMA IPS']] #extract kolom
    df = df.astype({'UN SMP': float, 'UN SMA IPA': float, 'UN SMA IPS': float}) #ubah dtypes
    df = df.rename(columns={'Nama Wilayah': 'Wilayah'}) #rename kolom 'Nama Wilayah' jadi 'Wilayah'
    df['Propinsi'] = df['Propinsi'].str.replace('Prov. ', '', regex=False) #menghapus 'Prov.'
    df['Tahun'] = tahun #menambahkan kolom tahun
    return df
Then let’s scrap all years data from 2015-2019.
Let’s do quick sanity check:
| Wilayah | Propinsi | UN SMP | UN SMA IPA | UN SMA IPS | Tahun | |
|---|---|---|---|---|---|---|
| 0 | Prov. D.K.I. Jakarta | D.K.I. Jakarta | 73.96 | 72.99 | 66.05 | 2015 |
| 1 | Kab. Kepulauan Seribu | D.K.I. Jakarta | 62.80 | 0.00 | 0.00 | 2015 |
| 2 | Kota Jakarta Pusat | D.K.I. Jakarta | 74.02 | 72.82 | 63.99 | 2015 |
| 3 | Kota Jakarta Utara | D.K.I. Jakarta | 71.22 | 69.54 | 63.31 | 2015 |
| 4 | Kota Jakarta Barat | D.K.I. Jakarta | 71.86 | 71.79 | 63.71 | 2015 |
| Wilayah | Propinsi | UN SMP | UN SMA IPA | UN SMA IPS | Tahun | |
|---|---|---|---|---|---|---|
| 0 | Prov. D.K.I. Jakarta | D.K.I. Jakarta | 62.17 | 67.99 | 63.75 | 2019 |
| 1 | Kab. Kepulauan Seribu | D.K.I. Jakarta | 45.26 | 0.00 | 0.00 | 2019 |
| 2 | Kota Jakarta Pusat | D.K.I. Jakarta | 60.97 | 69.43 | 64.01 | 2019 |
| 3 | Kota Jakarta Utara | D.K.I. Jakarta | 60.09 | 66.59 | 61.53 | 2019 |
| 4 | Kota Jakarta Barat | D.K.I. Jakarta | 60.42 | 69.31 | 63.85 | 2019 |
Even better, let’s combine all of the data into one big data:
Show Code
2015    547
2016    547
2017    547
2018    547
2019    547
Name: Tahun, dtype: int64
Data looks good, but just to be safe, let’s save it before we do anything stupid.
More DataViz…
Let’s see which 10 regions have the highest mean national exams.
Show Code
| Propinsi | UN SMA IPA | |
|---|---|---|
| 0 | D.I. Yogyakarta | 65.650000 |
| 1 | Jawa Tengah | 61.510000 |
| 2 | D.K.I. Jakarta | 58.410000 |
| 3 | Jawa Timur | 57.377949 |
| 4 | Bali | 55.901000 |
| 5 | Bangka Belitung | 55.407500 |
| 6 | Sumatera Barat | 54.978500 |
| 7 | Kalimantan Timur | 54.211818 |
| 8 | Jawa Barat | 53.813929 |
| 9 | Banten | 53.695556 |
Let’s do some plotting for all years.
Show Code
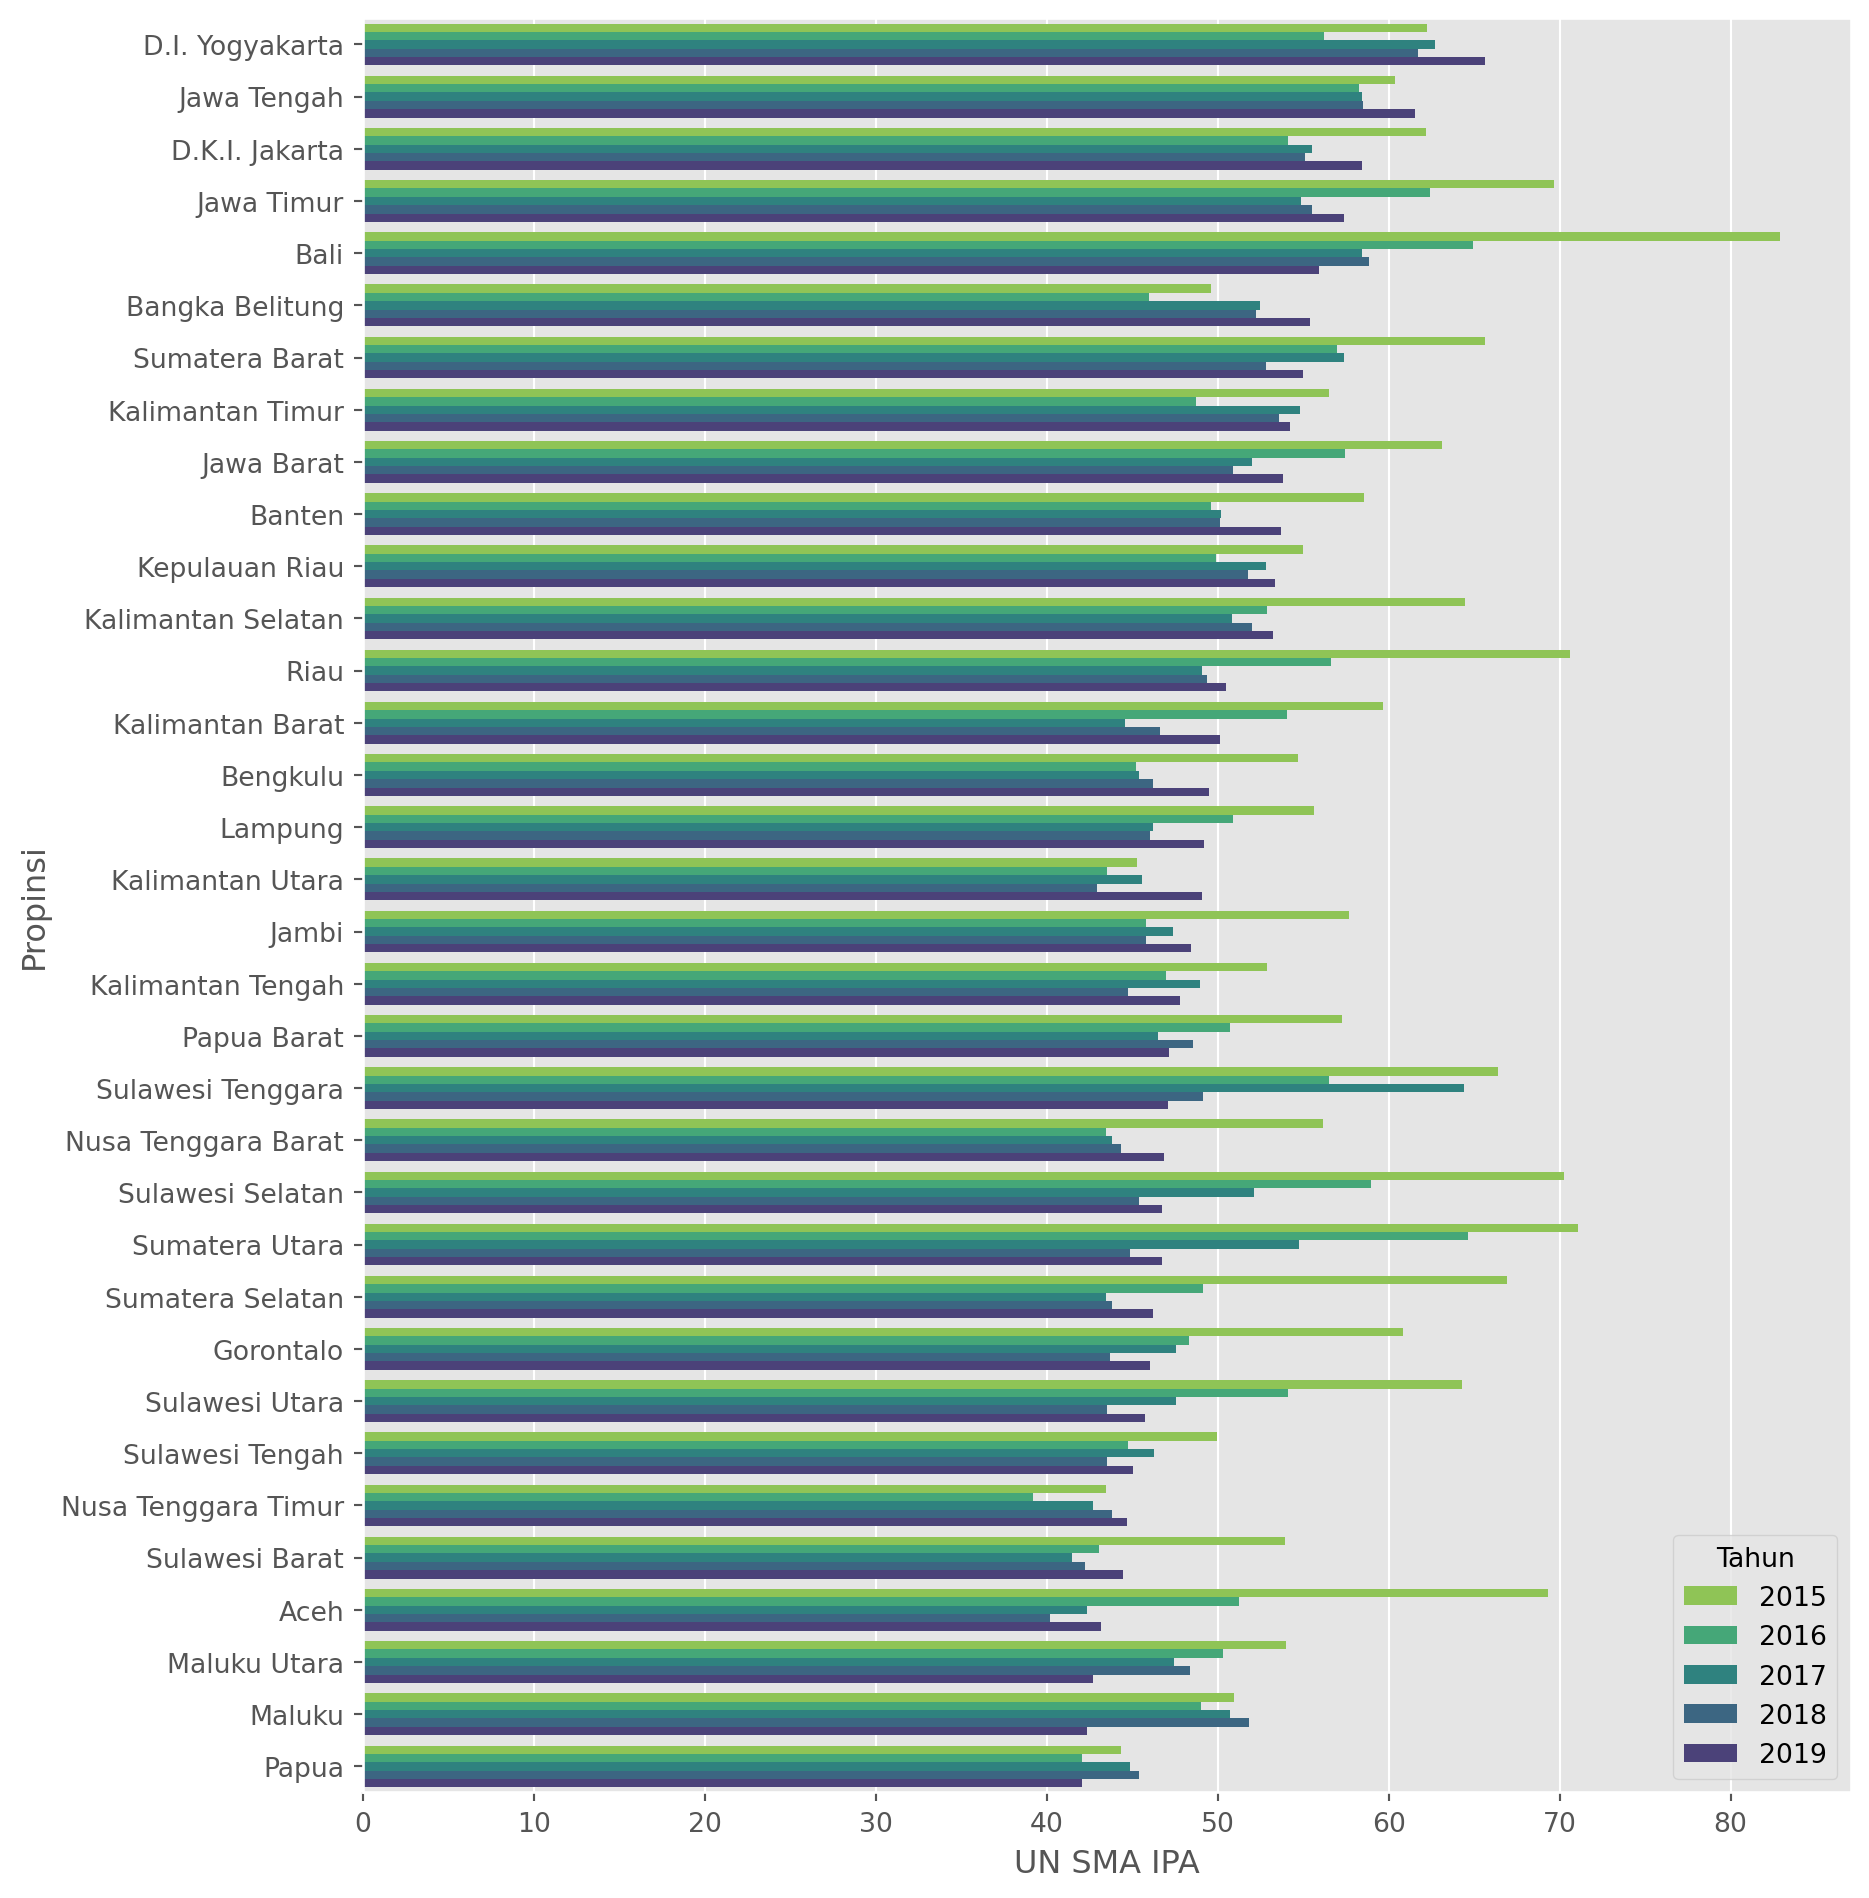
From the above figure, it looks like the Bali, D.I. Yogyakarta, similar to 2019 dataset is indeed appearing at the top-5.
But, let’s exclude year 2015 and 2016, as I think it is a bit an outlier in terms of value here.
Show Code
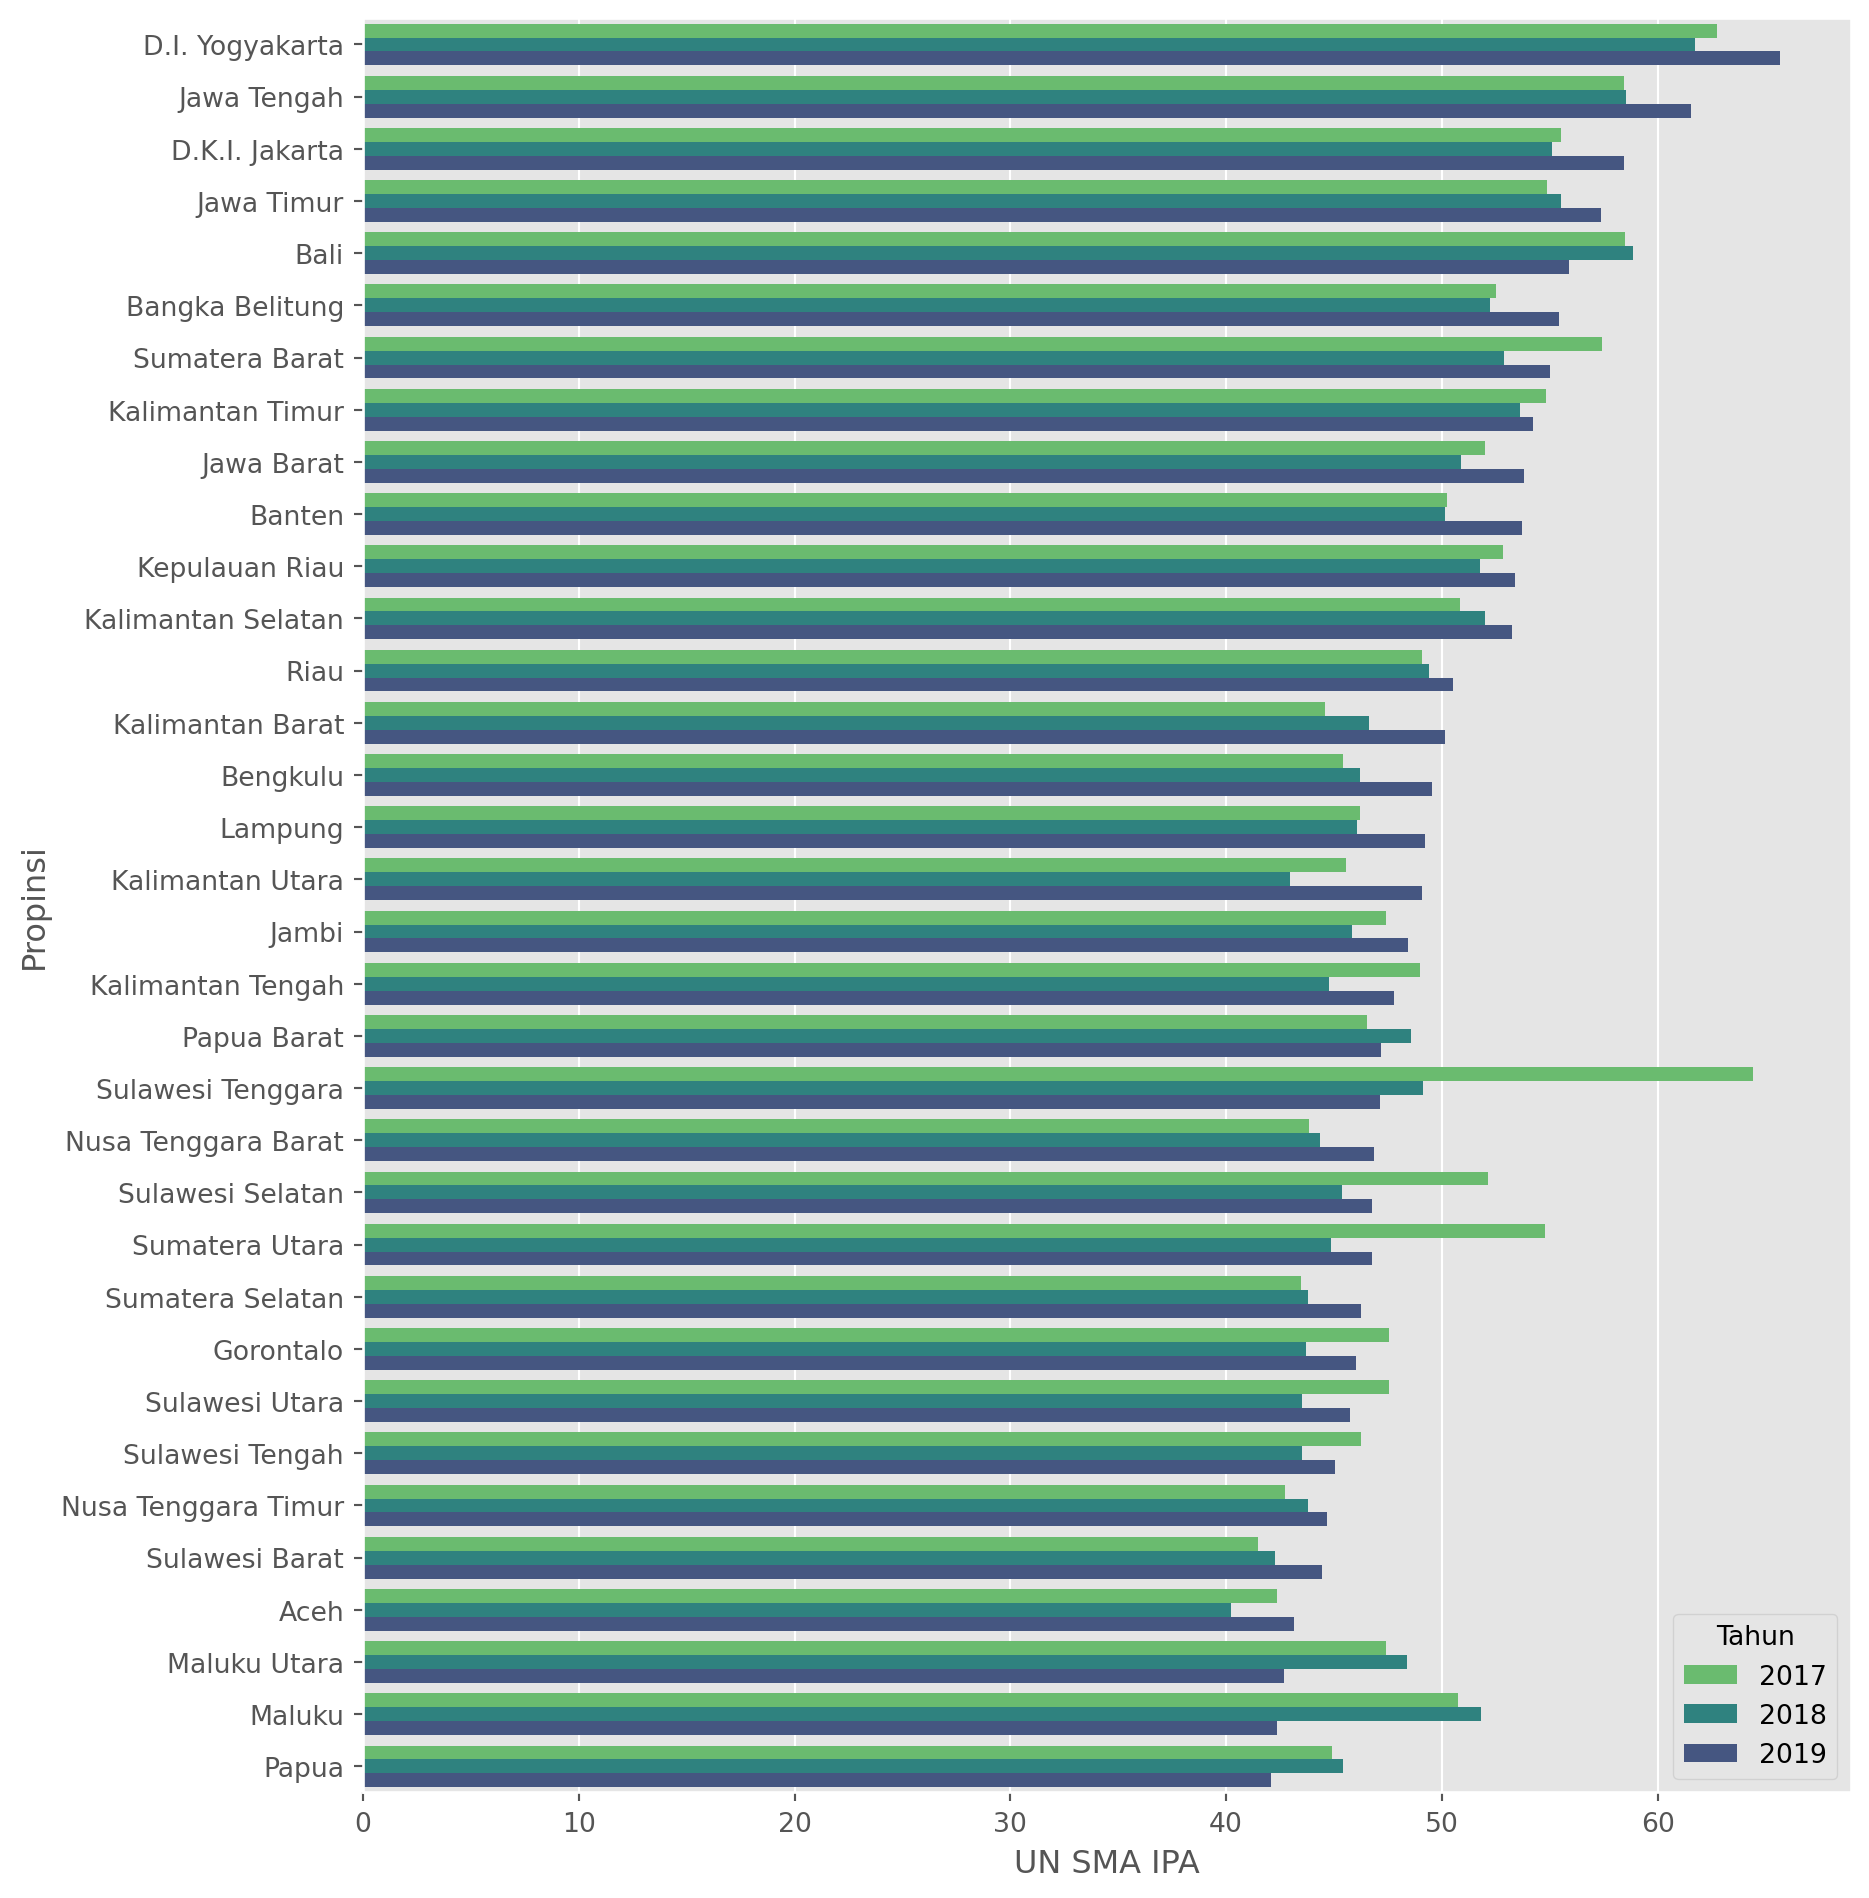
Just by looking at it, the big-five are from Java and Bali. Not until we reach rank 6 and below we see Bangka Belitung, Sumatera, and Kalimantan. Region outside Java and Bali.
Now let’s see if our thinking is right, by getting a top region on each national exams from junior to senior high schools.
Show Code
def get_max_prop(df):
    max_un_smp = df.groupby(['Propinsi'])['UN SMP'].mean().nlargest(1).index[0]
    max_un_sma_ipa = df.groupby(['Propinsi'])['UN SMA IPA'].mean().nlargest(1).index[0]
    max_un_sma_ips = df.groupby(['Propinsi'])['UN SMA IPS'].mean().nlargest(1).index[0]
    return [max_un_smp, max_un_sma_ipa, max_un_sma_ips]
Let’s do a loop over years;
Show Code
['D.K.I. Jakarta', 'Bali', 'Bali']
['D.I. Yogyakarta', 'Bali', 'Sumatera Utara']
['D.I. Yogyakarta', 'Sulawesi Tenggara', 'D.I. Yogyakarta']
['D.I. Yogyakarta', 'D.I. Yogyakarta', 'D.I. Yogyakarta']
['D.I. Yogyakarta', 'D.I. Yogyakarta', 'D.I. Yogyakarta']
From the above result, it was clear that excluding Sulawesi Tenggara, all of provinces here is coming from Java and Bali. Most notably D.I. Yogyakarta, D.K.I. Jakarta and Bali.
Let’s Talk about Kalimantan Timur
Why? Cause I was raised in Tenggarong, Kutai Kartanegara region, Kalimantan Timur Province. I spent my senior high school here, so I have my own thinking here.
My theory is even if Kalimantan Timur was up there at rank 8, it was not from Tenggarong.
Show Code
| Wilayah | Propinsi | UN SMP | UN SMA IPA | UN SMA IPS | Tahun | |
|---|---|---|---|---|---|---|
| 0 | Kab. Kutai Barat | Kalimantan Timur | 67.48 | 67.03 | 66.30 | 2015 |
| 1 | Kota Bontang | Kalimantan Timur | 61.46 | 66.26 | 58.32 | 2019 |
| 2 | Kota Bontang | Kalimantan Timur | 57.47 | 63.93 | 61.97 | 2017 |
| 3 | Kota Bontang | Kalimantan Timur | 58.06 | 63.40 | 58.75 | 2018 |
| 4 | Kab. Kutai Kartanegara | Kalimantan Timur | 55.74 | 62.27 | 61.03 | 2015 |
| 5 | Kota Balikpapan | Kalimantan Timur | 59.49 | 61.71 | 53.79 | 2019 |
| 6 | Kota Balikpapan | Kalimantan Timur | 57.87 | 61.30 | 51.25 | 2015 |
| 7 | Kota Bontang | Kalimantan Timur | 60.51 | 61.16 | 56.19 | 2016 |
| 8 | Kota Balikpapan | Kalimantan Timur | 55.50 | 60.94 | 53.81 | 2017 |
| 9 | Kota Balikpapan | Kalimantan Timur | 56.65 | 60.51 | 51.45 | 2018 |
Welp, no surprise there, I was right. My hometown (Kab. Kutai Kartanegara) did a good one in 2015, but that was it. The rest is Bontang, Balikpapan. Bontang, has a big industry from Pupuk Kaltim (PKT), and Balikpapan is a big Oil City with Airport, etc.
What do We Get?
I think it was clear now that education still very much an exclusive trait, owned by province, and place where there is an industry like Pupuk Kaltim Bontang, and Oil companies in Balikpapan. Places where not so much happening like Tenggarong, is very much stay behind the rest of Kalimantan Timur, and further behind the rest of the big cities in Java and Bali.
With the exclusion of National Exams as the only metric for student passing the bar, I wonder how could we as a nation measure the level of education on every province of Indonesia. For that, I wish my country the best - TIme will tell..I guess.
Citation
@online{wijaya2023,
  author = {Wijaya, A.A.},
  title = {Webscraping {National} {Exams} of {Indonesia}},
  date = {2023-01-31},
  url = {https://adtarie.net/posts/004-national-exam/},
  langid = {en}
}