Malaysia Property Pricing - Webscraping & Machine Learning Model

Full details on creating property dataset using webscraping, and building machine learning model to predict the rent price

project
data-science
python
webscraping
Author

Aditya Arie Wijaya

Published

February 10, 2023

Machine Learning Project

Pacmann Batch 8 Capstone by Aditya Arie Wijaya (aditya-66kK)

Introduction

This is a machine learning project to predict unit/property monthly rent price in Kuala Lumpur region, Malaysia. The project uses a dataset from an online ads listing for property mudah.my. This project outlines the process of web-scraping/ data gathering, data cleaning-wrangling, and machine learning modeling.

This project aims to answers question about how much a unit monthly rent would be if given information such as location, number of bedrooms, parking, furnished, etc? This would help potential tenant and also the owner to get the best price of their rental unit, comparable to the market value.

Some previous work about house pricing was listed below, however most of them are targeting a dataset of house pricing or an Airbnb pricing. There are difference such as in Airbnb, the booking rarely took more than 2 weeks, let alone a year. Therefore the pricing may be different. Additionally, in Airbnb, there is text feature coming from the review given by the tenant and the owner.The better the review, the higher the rent prices – which was not available in this current project dataset.

Previous work by (Madhuri, Anuradha, and Pujitha 2019), (Xu and Nguyen 2022), (Zhao et al. 2022) highlight the importance feature selection, and the choice of machine learning model. Based on the previous works, the most consistently performed machine learning model are Random Forest and Gradient boosting, and the MAE and R2 score usually used in evaluating the performance of the model. Although the above work are all not about apartment rent pricing, similar method can be applied to this project.

Data Gathering

The data will use a scraped data from the website mentioned before, focusing on property-to-rent surrounding Kuala Lumpur, Malaysia. Website

Show Code
#importing libraries
import pandas as pd
import numpy as np
import matplotlib.pyplot as plt
import seaborn as sns
pd.set_option('max_colwidth', 200)
from bs4 import BeautifulSoup as bs
import requests
import re
import time
import datetime
import smtplib
import json
from tqdm.notebook import tqdm, trange
import time    # to be used in loop iterations

!jupyter nbextension enable --py widgetsnbextension #enabling progress bar
Enabling notebook extension jupyter-js-widgets/extension...
      - Validating: problems found:
        - require?  X jupyter-js-widgets/extension

Web-Scraping Process

The process started out by gathering data from the website. We are using python library for web-scraping: BeautifulSoup as depicted below. The first process is generating a list of webpage address for a given page number.

Show Code
#generate list address of n_page
def page_number(start, end):
    """
    Description:
        Function to generate a list of webpage address for a given page number

    Parameters:
        start (int) : starting page number
        end (int)   : ending page number
    Returns:
        a list of listing web address 
    
    """
    
    page_url = 'https://www.mudah.my/kuala-lumpur/apartment-condominium-for-rent?o='
    list_page = []
    for i in range(start,end+1):
        list_page.append(page_url+str(i))
    return list_page
page_number(2,4)
['https://www.mudah.my/kuala-lumpur/apartment-condominium-for-rent?o=2',
 'https://www.mudah.my/kuala-lumpur/apartment-condominium-for-rent?o=3',
 'https://www.mudah.my/kuala-lumpur/apartment-condominium-for-rent?o=4']

Then generate a list of ads listing on a single page.

Show Code
#setting up list of page from 
def get_list_html(page_url):
    """
    Description:
        Function to get every listing ads in a given url (page_url)

    Parameters:
        page_url (str): website url
        
    Returns:
        a list of listing ads
    
    """
    headers = {"User-Agent": "Mozilla/5.0 (Macintosh; Intel Mac OS X 10_15_7) AppleWebKit/537.36 (KHTML, like Gecko) Chrome/109.0.0.0 Safari/537.36"}
    page = requests.get(url=page_url, headers=headers)
    soup = bs(page.text, "html.parser")

    script_tag = soup.find('script', type='application/ld+json')
    data = json.loads(script_tag.text)
    dict_query = data[2]['itemListElement']

    n_query = data[2]['numberOfItems']
    list_html = []

    for i in range(n_query):
        link = data[2]['itemListElement'][i]['item']['url']
        list_html.append(link)
        
    return list_html


#getting listing property from the 1st-5th in the list
get_list_html('https://www.mudah.my/neighbouring-kuala-lumpur/apartment-for-rent?o=2')[0:5]
['https://www.mudah.my/Suria+Court+Mahkota+Cheras+-100450215.htm',
 'https://www.mudah.my/Cemara+Apartment+Bandar+Sri+Permaisuri+Cheras+actual+pic-98750544.htm',
 'https://www.mudah.my/Seasons+Garden+PV21+850sf+3R2B+Fully+Furnished+Actual+Pics+-100449939.htm',
 'https://www.mudah.my/Pangsapuri+palma+puteri+with+fully+furnished+seksyen+6-92222541.htm',
 'https://www.mudah.my/STUDENT+Danau+Perintis+Fully+Furnish+WIFI+PUNCAK+ALAM-100143070.htm']

Combining the previous two functions, generate a list of url for all pages.

Show Code
#generate listing property from each page of n_page
def get_list_url(n_page):
    """
    Description:
        Function to get every listing ads in every page (n_page)

    Parameters:
        n_page (int): number of page
        
    Returns:
        a list of listing ads
    
    """
    list_html=[]
    for i in tqdm(range(n_page)):
        list_html.extend(get_list_html(page_number(1, n_page)[i]))
    return list_html

get_list_url(2)[:10]
['https://www.mudah.my/Pertiwi+Indah+1285sf+fully+furnished-98377671.htm',
 'https://www.mudah.my/PPA1M+Kepong+2+Parking+FULLY+FURNISHED+-95301490.htm',
 'https://www.mudah.my/PPA1M+Kepong+MARCH+2023+FULLY+FURNISHED+-98845611.htm',
 'https://www.mudah.my/Ixora+Apartment+Kepong+yang+lengkap+dengan+Time+Internet+Access-100451938.htm',
 'https://www.mudah.my/Pangsapuri+Permai+Sungai+Besi+3R2B+near+TBS+Bandar+Tasik+Selatan-98987533.htm',
 'https://www.mudah.my/Inspirasi+Mont+Kiara+BRAND+NEW+RENOVATED+MID+FLOOR+UNIT+NICE+VIEW+-99491862.htm',
 'https://www.mudah.my/Maxim+Residence+3+Room+3+Aircond+2+Car+Park+Walking+Distance+MRT-100451825.htm',
 'https://www.mudah.my/Residensi+Harmoni+2+Cheapest+Rental+Near+Mont+Kiara+Sri+Hartamas+KL-100451718.htm',
 'https://www.mudah.my/Angkasa+Condo+Taman+Connaught+Cheras+Walking+Distance+To+UCSI-100213869.htm',
 'https://www.mudah.my/Maxim+Residence+Condo+Taman+Len+Cheras-99852286.htm']

Then extract the attributes inside the listing ads in a form of nested dictionary.

Show Code
#extract data from url
def get_list_dict(n_page):
    """
    Description:
        Function to get dataset (atribut of units) in a form of dictionary. 

    Parameters:
        n_page (int): number of page
        
    Returns:
        a dictionaries of attributes inside a list
    
    """
    headers = {"User-Agent": "Mozilla/5.0 (Macintosh; Intel Mac OS X 10_15_7) AppleWebKit/537.36 (KHTML, like Gecko) Chrome/109.0.0.0 Safari/537.36"}
    list_html = get_list_url(n_page)
    list_dict = []
    for url in tqdm(list_html):
        try:
            page = requests.get(url=url, headers=headers)
            soup1 = bs(page.text, "html.parser")
            soup2 = bs(soup1.prettify(), 'html.parser')

            id_html = re.search(r'(\d+).htm', url).group(1)
            title = soup2.find(itemprop='name').text.strip()

            script_tag = soup2.find("script", id="__NEXT_DATA__")
            script_content = script_tag.text
            data = json.loads(script_content)
            props = data.get("props", {})
            id_listing = re.search(r'-(\d+)\.htm', url).group(1)

            dict_id = [{'realValue': '', 'id': 'ads_id', 'value': id_listing, 'label': 'id ads'}]
            dict_building = props["initialState"]["adDetails"]["byID"][id_listing]["attributes"]['propertyParams'][2]['params']
            dict_prop = props["initialState"]["adDetails"]["byID"][id_listing]["attributes"]['categoryParams']
            dict_unit = dict_id + dict_building + dict_prop
        except:
            None
        
        list_dict.append(dict_unit)
        
    return list_dict

#sanity check
get_list_dict(1)[1]
[{'realValue': '', 'id': 'ads_id', 'value': '95301490', 'label': 'id ads'},
 {'realValue': 'PPA1M METROPOLITAN KEPONG',
  'id': 'prop_name',
  'value': 'PPA1M METROPOLITAN KEPONG',
  'label': 'Building Name'},
 {'realValue': '', 'id': 'developer_name', 'value': '', 'label': 'Developer'},
 {'realValue': 'BLOK A PPA1M METROPOLITAN KEPONG MRR2, Kuala Lumpur, Kepong',
  'id': 'full_address',
  'value': 'BLOK A PPA1M METROPOLITAN KEPONG MRR2, Kuala Lumpur, Kepong',
  'label': 'Address'},
 {'realValue': '',
  'id': 'completion_year',
  'value': '',
  'label': 'Completion Year'},
 {'realValue': '', 'id': 'num_floors', 'value': '', 'label': '# of Floors'},
 {'realValue': '', 'id': 'num_units', 'value': '', 'label': 'Total Units'},
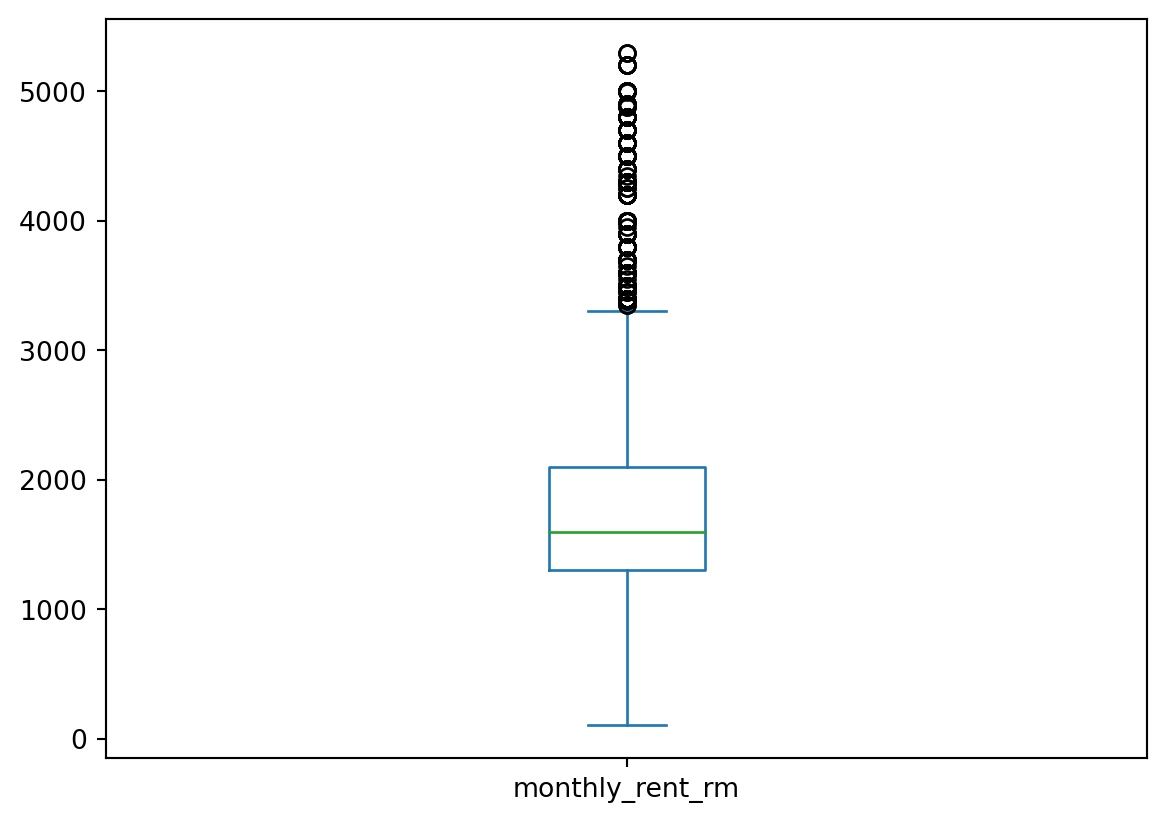
 {'realValue': 'RM 1 600 per month',
  'id': 'monthly_rent',
  'value': 'RM 1 600 per month',
  'label': 'Monthly Rent'},
 {'realValue': '2020',
  'id': 'category_id',
  'value': 'Apartment / Condominium, For rent',
  'label': 'Category'},
 {'realValue': '9',
  'id': 'location',
  'value': 'Kuala Lumpur - Kepong',
  'label': 'Location'},
 {'realValue': '1',
  'id': 'property_type',
  'value': 'Condominium',
  'label': 'Property Type'},
 {'realValue': '1',
  'id': 'floor_range',
  'value': 'High',
  'label': 'Floor Range'},
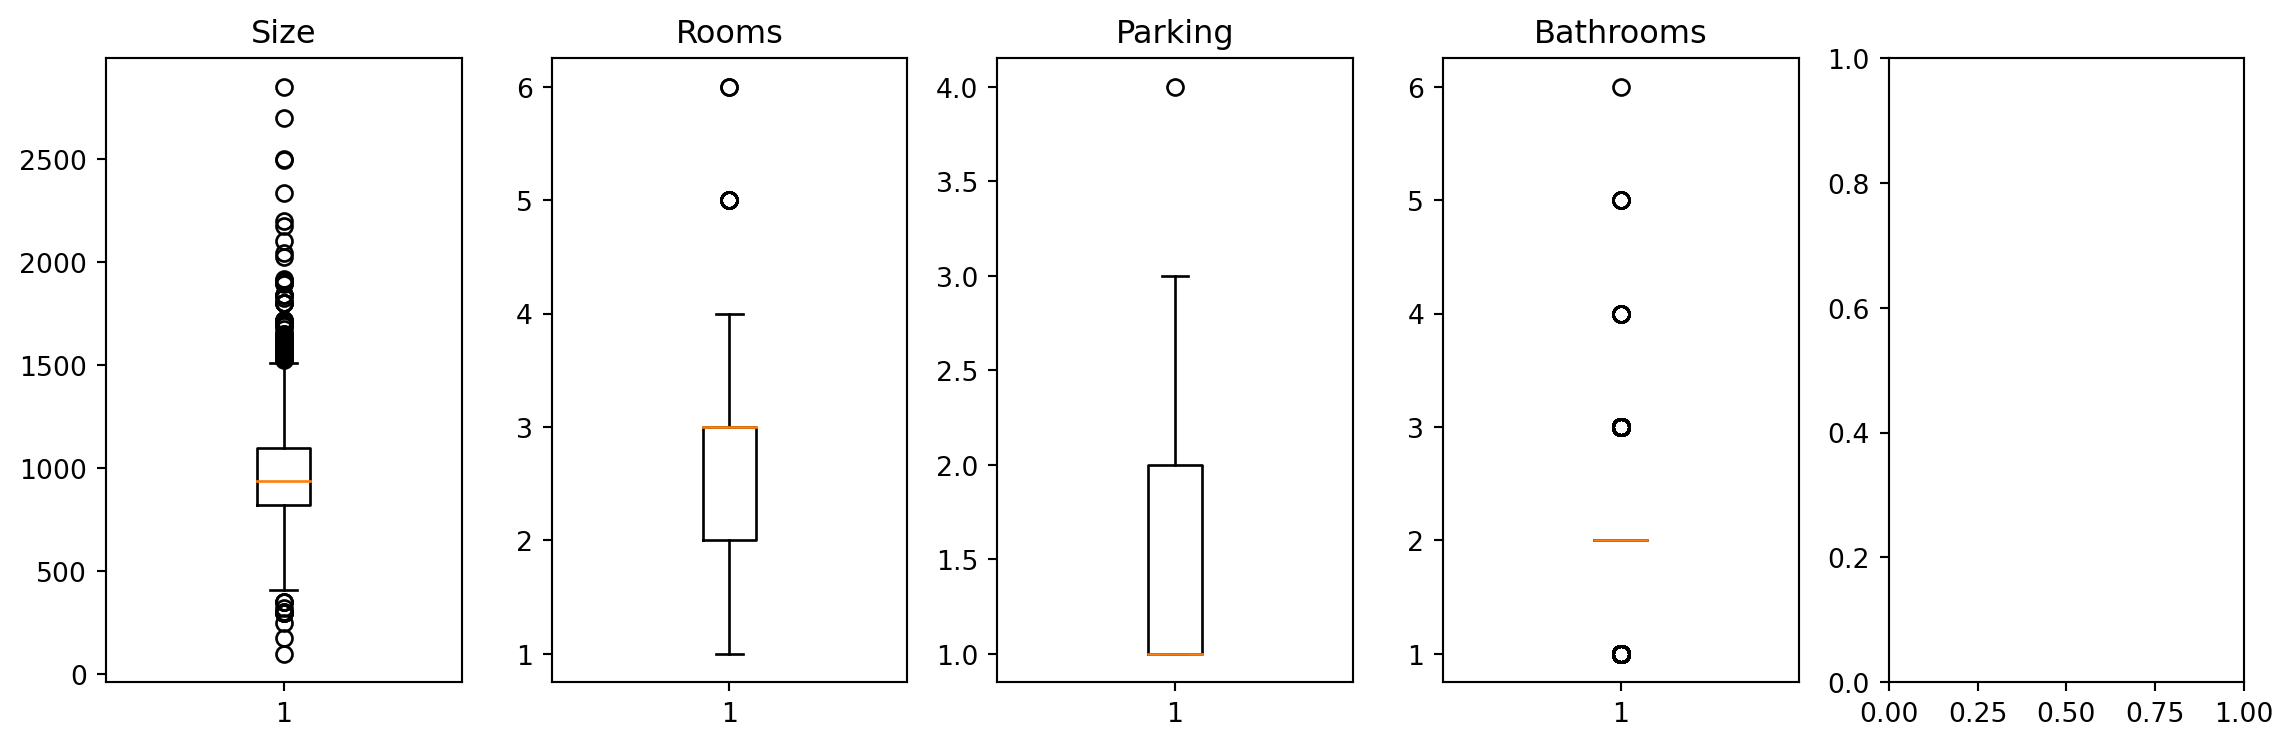
 {'realValue': '5', 'id': 'rooms', 'value': '5', 'label': 'Bedrooms'},
 {'realValue': '2', 'id': 'bathroom', 'value': '2', 'label': 'Bathroom'},
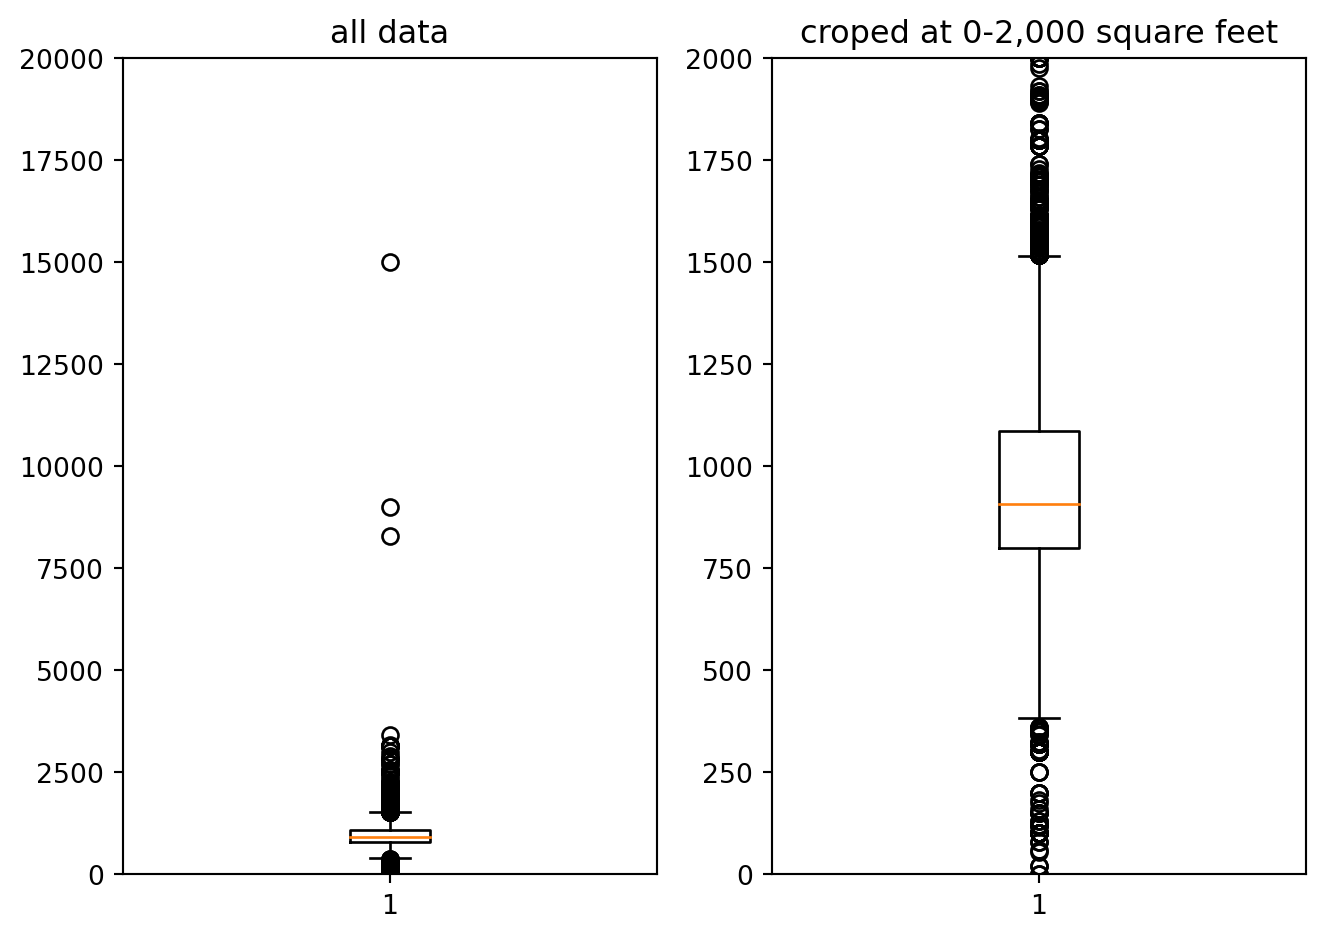
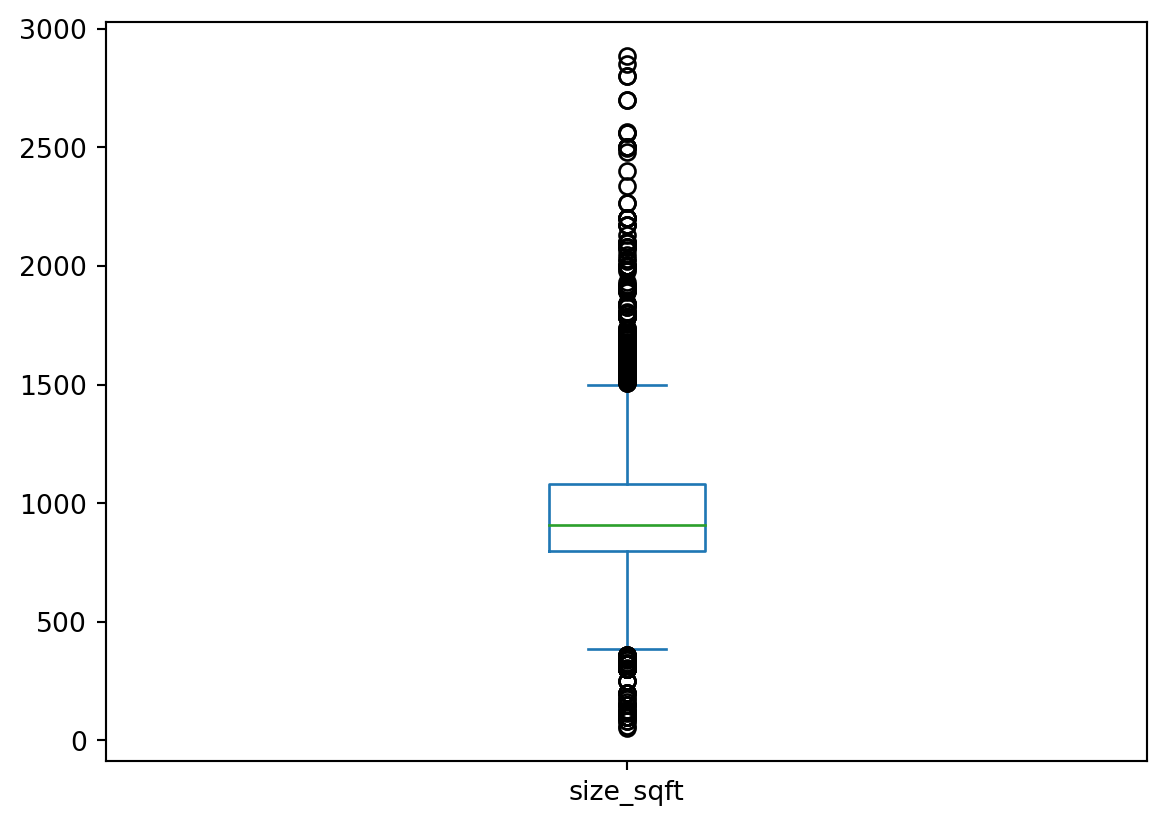
 {'realValue': '1500', 'id': 'size', 'value': '1500 sq.ft.', 'label': 'Size'},
 {'realValue': '1',
  'id': 'furnished',
  'value': 'Fully Furnished',
  'label': 'Furnished'},
 {'realValue': '13,9,12,7,5,16',
  'id': 'facilities',
  'value': 'Parking, Security, Lift, Playground, Minimart, Multipurpose hall',
  'label': 'Facilities'},
 {'realValue': '6200',
  'id': 'rendepo',
  'value': 'RM 6200',
  'label': 'Rental Deposit'},
 {'realValue': '1',
  'id': 'additional_facilities',
  'value': 'Air-Cond',
  'label': 'Other Facilities'},
 {'realValue': 'e', 'id': 'firm_type', 'value': 'E', 'label': 'Firm Type'},
 {'realValue': '10091',
  'id': 'estate_agent',
  'value': '10091',
  'label': 'Firm Number'}]

Extracting the values inside the dictionary for each attributes.

Show Code
#getting values out of dictionary
def get_values(list_dict):
    """
    Description:
        Function to values of the previous dictionary.

    Parameters:
        list_dict (list): list of dictionary where attributes stored
        
    Returns:
        a list of values (unit/property) attributes
    
    """
    keys = [
        'ads_id',
        'prop_name',
        # 'developer_name', 
        # 'address', 
        'completion_year', 
        # 'num_floors', 
        # 'num_units',
        'monthly_rent', 
        # 'category_id', 
        'location', 
        'property_type', 
        # 'floor_range', 
        'rooms', 
        'parking',
        'bathroom', 
        'size', 
        'furnished',
        'facilities', 
        'additional_facilities', 
       ]

    values = {}
    for key in keys:
        try:
            values[key] = next(item['value'] for item in list_dict if item["id"] == key)
        except StopIteration:
            values[key] = None
    return values

#sanity check
get_values(get_list_dict(1)[1])
{'ads_id': '95301490',
 'prop_name': 'PPA1M METROPOLITAN KEPONG',
 'completion_year': '',
 'monthly_rent': 'RM 1 600 per month',
 'location': 'Kuala Lumpur - Kepong',
 'property_type': 'Condominium',
 'rooms': '5',
 'parking': None,
 'bathroom': '2',
 'size': '1500 sq.ft.',
 'furnished': 'Fully Furnished',
 'facilities': 'Parking, Security, Lift, Playground, Minimart, Multipurpose hall',
 'additional_facilities': 'Air-Cond'}
Show Code
#get df from list
def get_df_final(n_page):
    """
    Description:
        Function to generate dataframe from the list.

    Parameters:
        n_page (int): number of page
        
    Returns:
        a dataframe of the list of attributes on each listings.
    
    """
    list_data = get_list_dict(n_page)
    list_new = []
    for i in range(0,len(list_data)):
            dic = get_values(list_data[i])
            list_new.append(dic)
    
    df = pd.DataFrame(list_new)
    return df

Of course we won’t scrape 250 pages at first, let’s extract 1 page only:

Show Code
#sanity check
get_df_final(1).head(2).T
0 1
ads_id 98377671 95301490
prop_name PPA1M METROPOLITAN KEPONG
completion_year
monthly_rent RM 2 000 per month RM 1 600 per month
location Kuala Lumpur - Cheras Kuala Lumpur - Kepong
property_type Condominium Condominium
rooms 3 5
parking 1 None
bathroom 2 2
size 1285 sq.ft. 1500 sq.ft.
furnished Fully Furnished Fully Furnished
facilities Parking, Security, Playground, Lift, Swimming Pool, Minimart Parking, Security, Lift, Playground, Minimart, Multipurpose hall
additional_facilities Air-Cond, Cooking Allowed Air-Cond

Finally, let’s extract dataset from 250 pages. File is then saved into a csv, to be reloaded again.

Show Code
# df_=get_df_final(250)
# df_.to_csv('mudah-apartment-raw.csv', index=False)
## already run, and file is saved

Data Understanding

Reload the original dataset.

Show Code
#read it back
df = pd.read_csv('./mudah-apartment-raw.csv')
df.head(3).T
0 1 2
ads_id 100323185 100203973 100323128
prop_name The Hipster @ Taman Desa Segar Courts Pangsapuri Teratak Muhibbah 2
completion_year 2022.0 NaN NaN
monthly_rent RM 4 200 per month RM 2 300 per month RM 1 000 per month
location Kuala Lumpur - Taman Desa Kuala Lumpur - Cheras Kuala Lumpur - Taman Desa
property_type Condominium Condominium Apartment
rooms 5 3 3
parking 2.0 1.0 NaN
bathroom 6.0 2.0 2.0
size 1842 sq.ft. 1170 sq.ft. 650 sq.ft.
furnished Fully Furnished Partially Furnished Fully Furnished
facilities Minimart, Gymnasium, Security, Playground, Swimming Pool, Parking, Lift, Barbeque area, Multipurpose hall, Jogging Track Playground, Parking, Barbeque area, Security, Jogging Track, Swimming Pool, Gymnasium, Lift, Sauna Minimart, Jogging Track, Lift, Swimming Pool
additional_facilities Air-Cond, Cooking Allowed, Washing Machine Air-Cond, Cooking Allowed, Near KTM/LRT NaN

Data Description

Show Code
df.info()
<class 'pandas.core.frame.DataFrame'>
RangeIndex: 10000 entries, 0 to 9999
Data columns (total 13 columns):
 #   Column                 Non-Null Count  Dtype  
---  ------                 --------------  -----  
 0   ads_id                 10000 non-null  int64  
 1   prop_name              9492 non-null   object 
 2   completion_year        5623 non-null   float64
 3   monthly_rent           10000 non-null  object 
 4   location               10000 non-null  object 
 5   property_type          10000 non-null  object 
 6   rooms                  9998 non-null   object 
 7   parking                7368 non-null   float64
 8   bathroom               9998 non-null   float64
 9   size                   10000 non-null  object 
 10  furnished              9999 non-null   object 
 11  facilities             9104 non-null   object 
 12  additional_facilities  7167 non-null   object 
dtypes: float64(3), int64(1), object(9)
memory usage: 1015.8+ KB

The following feature is available in the dataset:

  • ads_id: ads listing ID, unique to each ads
  • prop_name: the building name of the property
  • completion_year: year of the building/property completed
  • monthly_rent: monthly rent price in Malaysian Ringgit (RM)
  • location: the location (region) of the property
  • property_type: property type, such as flat, apartment, etc
  • rooms: number of rooms
  • parking: number of parking spot
  • bathroom: number of bathroom
  • size: total area of the unit in sq.ft
  • furnished: furnishin status of the unit, fully-partial-non
  • facilities: main facilities within the unit
  • additional_facilities: additional facilities

Drop Duplicate

Show Code
#cek duplikat
df.duplicated().sum()

#drop duplikat
df1 = df.drop_duplicates()

Saving the file to csv after remove duplicated values.

Show Code
# #saving to csv
# df1.to_csv("mudah-apartment-clean.csv", index=False)
# #saved already

Reload the data after drop duplicates

Show Code
#reload the data
df = pd.read_csv("./mudah-apartment-clean.csv")
Show Code
#sanity check
df.duplicated().sum()
0

Extracting Number and Keyword

Show Code
#removing RM from monthly rent
df['monthly_rent'] = df['monthly_rent'].apply(lambda x: int(re.search(r'RM (.*?) per', x).group(1).replace(' ', '')))
df = df.rename(columns={'monthly_rent': 'monthly_rent_rm'})

#dropping sq.ft from size
df['size'] = df['size'].apply(lambda x: int(re.search(r'(.*?) sq', x).group(1).replace(' ', '')))
df = df.rename(columns={'size': 'size_sqft'})

#dropping kuala lumpur from the location
df['location'] = df['location'].apply(lambda x: re.findall("\w+$", x)[0])
df.head(4).T
0 1 2 3
ads_id 100323185 100203973 100323128 100191767
prop_name The Hipster @ Taman Desa Segar Courts Pangsapuri Teratak Muhibbah 2 Sentul Point Suite Apartment
completion_year 2022.0 NaN NaN 2020.0
monthly_rent_rm 4200 2300 1000 1700
location Desa Cheras Desa Sentul
property_type Condominium Condominium Apartment Apartment
rooms 5 3 3 2
parking 2.0 1.0 NaN 1.0
bathroom 6.0 2.0 2.0 2.0
size_sqft 1842 1170 650 743
furnished Fully Furnished Partially Furnished Fully Furnished Partially Furnished
facilities Minimart, Gymnasium, Security, Playground, Swimming Pool, Parking, Lift, Barbeque area, Multipurpose hall, Jogging Track Playground, Parking, Barbeque area, Security, Jogging Track, Swimming Pool, Gymnasium, Lift, Sauna Minimart, Jogging Track, Lift, Swimming Pool Parking, Playground, Swimming Pool, Squash Court, Security, Minimart, Gymnasium, Lift
additional_facilities Air-Cond, Cooking Allowed, Washing Machine Air-Cond, Cooking Allowed, Near KTM/LRT NaN Cooking Allowed, Near KTM/LRT, Washing Machine

Extracting Near KTM/LRT

Hypotheses: closer access to KTM/LRT = higher monthly rent

Show Code
#extracting near KTM/LRT from the additional facilities
def extract_near_ktm_lrt(text):
    pattern = re.compile(r'\bNear KTM/LRT\b')
    try:
        match = pattern.search(text)
        if match:
            return 'yes'
        return 'no'
    except TypeError:
        return text

Extracting “near KTM/LRT” into its own column.

Show Code
df['nearby_railways'] = df.additional_facilities.apply(lambda x: extract_near_ktm_lrt(x))
df.head(4).T
0 1 2 3
ads_id 100323185 100203973 100323128 100191767
prop_name The Hipster @ Taman Desa Segar Courts Pangsapuri Teratak Muhibbah 2 Sentul Point Suite Apartment
completion_year 2022.0 NaN NaN 2020.0
monthly_rent_rm 4200 2300 1000 1700
location Desa Cheras Desa Sentul
property_type Condominium Condominium Apartment Apartment
rooms 5 3 3 2
parking 2.0 1.0 NaN 1.0
bathroom 6.0 2.0 2.0 2.0
size_sqft 1842 1170 650 743
furnished Fully Furnished Partially Furnished Fully Furnished Partially Furnished
facilities Minimart, Gymnasium, Security, Playground, Swimming Pool, Parking, Lift, Barbeque area, Multipurpose hall, Jogging Track Playground, Parking, Barbeque area, Security, Jogging Track, Swimming Pool, Gymnasium, Lift, Sauna Minimart, Jogging Track, Lift, Swimming Pool Parking, Playground, Swimming Pool, Squash Court, Security, Minimart, Gymnasium, Lift
additional_facilities Air-Cond, Cooking Allowed, Washing Machine Air-Cond, Cooking Allowed, Near KTM/LRT NaN Cooking Allowed, Near KTM/LRT, Washing Machine
nearby_railways no yes NaN yes

Plotting the difference between nearby KTM/LRT or not:

Show Code
sns.boxplot(data=df, x='monthly_rent_rm', y='nearby_railways')
plt.xlim(0,4000);

near_ktmlrt = df.query(" nearby_railways == 'yes' ")
not_near_ktmlrt = df.query(" nearby_railways == 'no' ")

print(f""" 
Median:
Nearby KTM/LRT: {near_ktmlrt.monthly_rent_rm.median():.0f}RM
Not nearby KTM/LRT: {not_near_ktmlrt.monthly_rent_rm.median():.0f}RM
      """)
 
Median:
Nearby KTM/LRT: 1650RM
Not nearby KTM/LRT: 1600RM
      
Figure 1: Boxplot between Nearby KTM/LRT or Not

Sanity check:

Show Code
df[df['prop_name'] == 'Majestic Maxim'][['nearby_railways']].value_counts()
nearby_railways
yes                166
no                  24
dtype: int64

As seen above, Figure 1 shows that it sligthly increases the median monthly rent by 50RM. However, near KTM/LRT is not appearing in all row even though the property is the same

Conclusion: Near KTM/LRT may be used, but it can be improved as the listing is inconsistent

Drop Missing Values in Facilities and Additional Facilities

Show Code
df.isna().sum()
ads_id                      0
prop_name                 508
completion_year          4373
monthly_rent_rm             0
location                    0
property_type               0
rooms                       2
parking                  2630
bathroom                    2
size_sqft                   0
furnished                   1
facilities                895
additional_facilities    2831
nearby_railways          2831
dtype: int64
Show Code
#dropping some columns
df = df.drop(columns=[
    'ads_id', 
    'prop_name', 
    'facilities', 
    'additional_facilities',
    # 'nearby_railways',
    # 'completion_year'
])
df
completion_year monthly_rent_rm location property_type rooms parking bathroom size_sqft furnished nearby_railways
0 2022.0 4200 Desa Condominium 5 2.0 6.0 1842 Fully Furnished no
1 NaN 2300 Cheras Condominium 3 1.0 2.0 1170 Partially Furnished yes
2 NaN 1000 Desa Apartment 3 NaN 2.0 650 Fully Furnished NaN
3 2020.0 1700 Sentul Apartment 2 1.0 2.0 743 Partially Furnished yes
4 NaN 1299 Kiara Service Residence 1 1.0 1.0 494 Not Furnished no
... ... ... ... ... ... ... ... ... ... ...
9986 2017.0 1400 Sentul Service Residence 3 1.0 2.0 900 Not Furnished no
9987 1998.0 1000 Desa Apartment 3 NaN 2.0 657 Fully Furnished no
9988 2021.0 1488 Cheras Condominium 3 2.0 2.0 1000 Partially Furnished yes
9989 1988.0 2000 Desa Condominium 3 2.0 2.0 1200 Fully Furnished no
9990 NaN 2000 Cheras Condominium 3 2.0 3.0 1010 Fully Furnished yes

9991 rows × 10 columns

Show Code
#checking dtypes from all columns
df.info()
<class 'pandas.core.frame.DataFrame'>
RangeIndex: 9991 entries, 0 to 9990
Data columns (total 10 columns):
 #   Column           Non-Null Count  Dtype  
---  ------           --------------  -----  
 0   completion_year  5618 non-null   float64
 1   monthly_rent_rm  9991 non-null   int64  
 2   location         9991 non-null   object 
 3   property_type    9991 non-null   object 
 4   rooms            9989 non-null   object 
 5   parking          7361 non-null   float64
 6   bathroom         9989 non-null   float64
 7   size_sqft        9991 non-null   int64  
 8   furnished        9990 non-null   object 
 9   nearby_railways  7160 non-null   object 
dtypes: float64(3), int64(2), object(5)
memory usage: 780.7+ KB
Show Code
#converting rooms from object to int64
df['rooms'] = pd.to_numeric(df['rooms'], downcast='integer', errors='coerce')
df.info()
<class 'pandas.core.frame.DataFrame'>
RangeIndex: 9991 entries, 0 to 9990
Data columns (total 10 columns):
 #   Column           Non-Null Count  Dtype  
---  ------           --------------  -----  
 0   completion_year  5618 non-null   float64
 1   monthly_rent_rm  9991 non-null   int64  
 2   location         9991 non-null   object 
 3   property_type    9991 non-null   object 
 4   rooms            9987 non-null   float64
 5   parking          7361 non-null   float64
 6   bathroom         9989 non-null   float64
 7   size_sqft        9991 non-null   int64  
 8   furnished        9990 non-null   object 
 9   nearby_railways  7160 non-null   object 
dtypes: float64(4), int64(2), object(4)
memory usage: 780.7+ KB

Outlier Removal

To remove some unexplainable data such as 0 monthly rent, 0 size, the rent that is way too old (1970), including the monthly rent that is way too high and/or size too big.

Show Code
df[['size_sqft', 'monthly_rent_rm']].plot(kind='scatter', x='size_sqft', y='monthly_rent_rm');
plt.ylim(100,5500) #batas harga rent
plt.xlim(50,3000)  #batas size
plt.show()
Figure 2: Monthly Rent
Monthly Rent
Show Code
fig, axs = plt.subplots(1,2)
axs[0].boxplot(data=df, x='monthly_rent_rm')
axs[0].set_ylim(0,20000)
axs[0].set_title('all data')

axs[1].boxplot(data=df, x='monthly_rent_rm')
axs[1].set_ylim(0,5000)
axs[1].set_title('croped at 5,000 RM')

plt.tight_layout()
plt.show()
Figure 3: Comparison between Different Scale

Based on EDA on Figure 2 and Figure 3, author decided to filter the data between 100-5500 RM as follows:

Show Code
#removing all rows with monthly rent above 5500 RM and below 100RM
dfx = df.query(" monthly_rent_rm > 100 & monthly_rent_rm < 5500 ")
dfx.describe()
completion_year monthly_rent_rm rooms parking bathroom size_sqft
count 5530.000000 9841.000000 9838.000000 7245.000000 9840.000000 9.841000e+03
mean 2014.863110 1786.840260 2.742427 1.339268 1.928760 1.111279e+04
std 7.436904 768.813626 0.763700 0.517512 0.517118 1.008037e+06
min 1980.000000 110.000000 1.000000 1.000000 1.000000 1.000000e+00
25% 2011.000000 1300.000000 2.000000 1.000000 2.000000 8.000000e+02
50% 2017.000000 1600.000000 3.000000 1.000000 2.000000 9.080000e+02
75% 2020.000000 2100.000000 3.000000 2.000000 2.000000 1.087000e+03
max 2025.000000 5300.000000 9.000000 10.000000 6.000000 1.000000e+08

Sanity check after removal as shown in Figure 4 belo:

Show Code
dfx.monthly_rent_rm.plot(kind='box', x='monthly_rent_rm');
Figure 4: Data after Outlier Removal

Size

Checking the dataset in terms of size.

Show Code
fig, axs = plt.subplots(1,2)
axs[0].boxplot(data=dfx, x='size_sqft')
axs[0].set_ylim(0,20000)
axs[0].set_title('all data')

axs[1].boxplot(data=dfx, x='size_sqft')
axs[1].set_ylim(0,2000)
axs[1].set_title('croped at 0-2,000 square feet')

plt.tight_layout()
plt.show()
Figure 5: Raw Data Size sq.ft

Still based on Figure 2, outliers are removed.

Show Code
#removing outliers below 500, and higher than 3000 sqft and below 50 sqft
dfx = \
(dfx.query(" size_sqft > 50 & size_sqft < 3000 ")
 # .size_sqft
 # .plot(kind='box')
)
dfx
completion_year monthly_rent_rm location property_type rooms parking bathroom size_sqft furnished nearby_railways
0 2022.0 4200 Desa Condominium 5.0 2.0 6.0 1842 Fully Furnished no
1 NaN 2300 Cheras Condominium 3.0 1.0 2.0 1170 Partially Furnished yes
2 NaN 1000 Desa Apartment 3.0 NaN 2.0 650 Fully Furnished NaN
3 2020.0 1700 Sentul Apartment 2.0 1.0 2.0 743 Partially Furnished yes
4 NaN 1299 Kiara Service Residence 1.0 1.0 1.0 494 Not Furnished no
... ... ... ... ... ... ... ... ... ... ...
9986 2017.0 1400 Sentul Service Residence 3.0 1.0 2.0 900 Not Furnished no
9987 1998.0 1000 Desa Apartment 3.0 NaN 2.0 657 Fully Furnished no
9988 2021.0 1488 Cheras Condominium 3.0 2.0 2.0 1000 Partially Furnished yes
9989 1988.0 2000 Desa Condominium 3.0 2.0 2.0 1200 Fully Furnished no
9990 NaN 2000 Cheras Condominium 3.0 2.0 3.0 1010 Fully Furnished yes

9822 rows × 10 columns

Sanity check:

Show Code
dfx.size_sqft.plot(kind='box');

Show Code
fig, axs = plt.subplots(1,5, figsize=(12,4))
axs[0].boxplot(data=dfx.dropna(), x='size_sqft')
axs[1].boxplot(data=dfx.dropna(), x='rooms')
axs[2].boxplot(data=dfx.dropna(), x='parking')
axs[3].boxplot(data=dfx.dropna(), x='bathroom')
# axs[4].boxplot(data=dfx.dropna(), x='completion_year')

axs[0].set_title('Size')
axs[1].set_title('Rooms')
axs[2].set_title('Parking')
axs[3].set_title('Bathrooms')
# axs[4].set_title('Completion Year')

plt.tight_layout()
plt.show()
Figure 6: Final Data after Outlier Removal

Data Preprocessing

Input-Output

Show Code
def extractInputOutput(data,
                       output_column_name):
    """
    Fungsi untuk memisahkan data input dan output
    :param data: <pandas dataframe> data seluruh sample
    :param output_column_name: <string> nama kolom output
    :return input_data: <pandas dataframe> data input
    :return output_data: <pandas series> data output
    """
    output_data = data[output_column_name]
    input_data = data.drop(output_column_name,
                           axis = 1)
    
    return input_data, output_data
Show Code
X, y = extractInputOutput(data=dfx, output_column_name='monthly_rent_rm')
Show Code
X
completion_year location property_type rooms parking bathroom size_sqft furnished nearby_railways
0 2022.0 Desa Condominium 5.0 2.0 6.0 1842 Fully Furnished no
1 NaN Cheras Condominium 3.0 1.0 2.0 1170 Partially Furnished yes
2 NaN Desa Apartment 3.0 NaN 2.0 650 Fully Furnished NaN
3 2020.0 Sentul Apartment 2.0 1.0 2.0 743 Partially Furnished yes
4 NaN Kiara Service Residence 1.0 1.0 1.0 494 Not Furnished no
... ... ... ... ... ... ... ... ... ...
9986 2017.0 Sentul Service Residence 3.0 1.0 2.0 900 Not Furnished no
9987 1998.0 Desa Apartment 3.0 NaN 2.0 657 Fully Furnished no
9988 2021.0 Cheras Condominium 3.0 2.0 2.0 1000 Partially Furnished yes
9989 1988.0 Desa Condominium 3.0 2.0 2.0 1200 Fully Furnished no
9990 NaN Cheras Condominium 3.0 2.0 3.0 1010 Fully Furnished yes

9822 rows × 9 columns

Show Code
y
0       4200
1       2300
2       1000
3       1700
4       1299
        ... 
9986    1400
9987    1000
9988    1488
9989    2000
9990    2000
Name: monthly_rent_rm, Length: 9822, dtype: int64

Train-Test Split Data

Show Code
#import libraries
from sklearn.model_selection import train_test_split
Show Code
# Train test split
X_train, X_test, y_train, y_test = train_test_split(X, y,
                                                    test_size = 0.2,
                                                    random_state = 123)
Show Code
#sanity check
len(X_test)/len(X)
0.20006108735491754
Show Code
#sanity check
X_train
completion_year location property_type rooms parking bathroom size_sqft furnished nearby_railways
5978 2020.0 Sentul Apartment 3.0 1.0 2.0 876 Partially Furnished yes
2151 2022.0 Setapak Condominium 3.0 1.0 2.0 850 Fully Furnished yes
9714 2002.0 Cheras Condominium 3.0 NaN 2.0 1000 Fully Furnished yes
8556 2021.0 Cheras Service Residence 2.0 1.0 2.0 680 Partially Furnished yes
2809 2005.0 Cheras Condominium 3.0 1.0 2.0 920 Partially Furnished NaN
... ... ... ... ... ... ... ... ... ...
9954 2016.0 Besi Service Residence 3.0 2.0 2.0 1121 Partially Furnished yes
7901 NaN Jalil Flat 3.0 NaN 2.0 650 Not Furnished yes
5322 2013.0 Kepong Condominium 3.0 2.0 2.0 1378 Fully Furnished no
1363 NaN Desa Condominium 3.0 1.0 2.0 950 Partially Furnished NaN
3648 2019.0 KLCC Service Residence 2.0 1.0 2.0 796 Fully Furnished NaN

7857 rows × 9 columns

Preprocessing Original Data for Categorical Dtypes

One must paying attention to the number of categorical observation in the original data, with respect to the sampling train-test value. If, the test_size = 0.3, that means any categorical observation with a total of 3 and less, would not be distributed evenly among train and test data.

Show Code
print(dfx.location.nunique())
print(X_train.location.nunique())
print(X_test.location.nunique())
53
53
50
Show Code
print(dfx.property_type.nunique())
print(X_train.property_type.nunique())
print(X_test.property_type.nunique())
9
9
8
Show Code
print(set(X_train.furnished.to_list()) - set(X_test.furnished.to_list()))
print(set(X_train.location.to_list()) - set(X_test.location.to_list()))
print(set(X_train.property_type.to_list()) - set(X_test.property_type.to_list()))
print(set(X_train.nearby_railways.to_list()) - set(X_test.nearby_railways.to_list()))
set()
{'Sentral', 'Lin', 'Penchala'}
{'Condo / Services residence / Penthouse / Townhouse'}
set()

Dropping Data

Show Code
dfx
completion_year monthly_rent_rm location property_type rooms parking bathroom size_sqft furnished nearby_railways
0 2022.0 4200 Desa Condominium 5.0 2.0 6.0 1842 Fully Furnished no
1 NaN 2300 Cheras Condominium 3.0 1.0 2.0 1170 Partially Furnished yes
2 NaN 1000 Desa Apartment 3.0 NaN 2.0 650 Fully Furnished NaN
3 2020.0 1700 Sentul Apartment 2.0 1.0 2.0 743 Partially Furnished yes
4 NaN 1299 Kiara Service Residence 1.0 1.0 1.0 494 Not Furnished no
... ... ... ... ... ... ... ... ... ... ...
9986 2017.0 1400 Sentul Service Residence 3.0 1.0 2.0 900 Not Furnished no
9987 1998.0 1000 Desa Apartment 3.0 NaN 2.0 657 Fully Furnished no
9988 2021.0 1488 Cheras Condominium 3.0 2.0 2.0 1000 Partially Furnished yes
9989 1988.0 2000 Desa Condominium 3.0 2.0 2.0 1200 Fully Furnished no
9990 NaN 2000 Cheras Condominium 3.0 2.0 3.0 1010 Fully Furnished yes

9822 rows × 10 columns

Show Code
dfx.location.value_counts()
Cheras         1614
Setapak         965
Sentul          776
Kepong          662
Jalil           577
Maju            456
Ampang          327
Keramat         300
Road            298
Desa            295
City            268
Kiara           264
KLCC            239
Ipoh            224
Lama            193
Segambut        178
Petaling        174
Pandan          173
Besi            173
Kuching         168
South           143
Pantai          113
Bintang          99
Melawati         91
Titiwangsa       83
Hilir            78
Hartamas         75
Damansara        73
OUG              63
Ismail           59
Dutamas          57
Gombak           56
Perdana          53
Setiawangsa      50
ParkCity         50
Bangsar          47
Menjalara        45
Seputeh          35
Puchong          33
Indah            29
Centre           25
Jaya             24
Brickfields      24
Pudu             24
Selatan          19
Heights          18
Jinjang           9
Serdang           9
Sentral           5
Others            5
Tunku             2
Penchala          1
Lin               1
Name: location, dtype: int64
Show Code
dfx.property_type.value_counts()
Condominium                                           4698
Service Residence                                     2647
Apartment                                             2123
Flat                                                   265
Studio                                                  27
Duplex                                                  27
Others                                                  27
Townhouse Condo                                          7
Condo / Services residence / Penthouse / Townhouse       1
Name: property_type, dtype: int64
Show Code
dfx_new = dfx[
    (dfx.location != 'Jinjang') 
    & (dfx.location != 'Serdang') & 
    (dfx.location != 'Sentral') & 
    (dfx.location != 'Others') & 
    (dfx.location != 'Tunku') & 
    (dfx.location != 'Penchala') & 
    (dfx.location != 'Lin') &
    # (dfx.property_type != 'Others') &
    (dfx.property_type != 'Condo / Services residence / Penthouse / Townhouse') &
    (dfx.property_type != 'Townhouse Condo')
]
Show Code
dfx_new.property_type.value_counts()
Condominium          4683
Service Residence    2642
Apartment            2115
Flat                  263
Duplex                 27
Studio                 26
Others                 26
Name: property_type, dtype: int64

Re-split Training-Test

Show Code
X, y = extractInputOutput(data=dfx_new, output_column_name='monthly_rent_rm')
Show Code
#import libraries
from sklearn.model_selection import train_test_split
Show Code
# Train test split
X_train, X_test, y_train, y_test = train_test_split(X, y,
                                                    test_size = 0.2,
                                                    random_state = 123)
Show Code
#sanity check
len(X_test)/len(X)
0.2000613371498671
Show Code
X_train
completion_year location property_type rooms parking bathroom size_sqft furnished nearby_railways
8649 NaN Maju Condominium 2.0 1.0 1.0 800 Fully Furnished yes
9112 1993.0 Bangsar Condominium 2.0 1.0 1.0 890 Fully Furnished yes
1472 NaN Jalil Condominium 1.0 NaN 1.0 1200 Fully Furnished yes
5536 NaN Cheras Condominium 3.0 2.0 2.0 893 Fully Furnished no
8152 NaN Pudu Apartment 3.0 NaN 2.0 980 Partially Furnished yes
... ... ... ... ... ... ... ... ... ...
7541 2001.0 Ampang Apartment 3.0 NaN 2.0 828 Partially Furnished NaN
7927 NaN South Flat 3.0 NaN 2.0 750 Not Furnished NaN
5340 2023.0 Cheras Condominium 4.0 2.0 2.0 1000 Partially Furnished yes
1369 NaN KLCC Condominium 1.0 NaN 1.0 473 Fully Furnished yes
3659 2017.0 Road Service Residence 3.0 NaN 2.0 953 Partially Furnished NaN

7825 rows × 9 columns

Show Code
print(set(X_train.furnished.to_list()) - set(X_test.furnished.to_list()))
print(set(X_train.location.to_list()) - set(X_test.location.to_list()))
print(set(X_train.property_type.to_list()) - set(X_test.property_type.to_list()))
# print(set(X_train.nearby_railways.to_list()) - set(X_test.nearby_railways.to_list()))
set()
set()
set()
Show Code
print(dfx_new.location.nunique())
print(X_train.location.nunique())
print(X_test.location.nunique())
46
46
46
Show Code
#sanity check
X_train
completion_year location property_type rooms parking bathroom size_sqft furnished nearby_railways
8649 NaN Maju Condominium 2.0 1.0 1.0 800 Fully Furnished yes
9112 1993.0 Bangsar Condominium 2.0 1.0 1.0 890 Fully Furnished yes
1472 NaN Jalil Condominium 1.0 NaN 1.0 1200 Fully Furnished yes
5536 NaN Cheras Condominium 3.0 2.0 2.0 893 Fully Furnished no
8152 NaN Pudu Apartment 3.0 NaN 2.0 980 Partially Furnished yes
... ... ... ... ... ... ... ... ... ...
7541 2001.0 Ampang Apartment 3.0 NaN 2.0 828 Partially Furnished NaN
7927 NaN South Flat 3.0 NaN 2.0 750 Not Furnished NaN
5340 2023.0 Cheras Condominium 4.0 2.0 2.0 1000 Partially Furnished yes
1369 NaN KLCC Condominium 1.0 NaN 1.0 473 Fully Furnished yes
3659 2017.0 Road Service Residence 3.0 NaN 2.0 953 Partially Furnished NaN

7825 rows × 9 columns

Show Code
#export data training
X_train.to_csv('X_train.csv', index=False)
y_train.to_csv('y_train.csv', index=False)
Show Code
#export data testing
X_test.to_csv('X_test.csv', index=False)
y_test.to_csv('y_test.csv', index=False)

Training Data Imputation

Show Code
#checking null data
X_train.isna().sum()
completion_year    3438
location              0
property_type         0
rooms                 2
parking            2074
bathroom              0
size_sqft             0
furnished             0
nearby_railways    2206
dtype: int64

Numerical Data

Show Code
X_train_num =  X_train.select_dtypes(exclude='object')
X_train_num
completion_year rooms parking bathroom size_sqft
8649 NaN 2.0 1.0 1.0 800
9112 1993.0 2.0 1.0 1.0 890
1472 NaN 1.0 NaN 1.0 1200
5536 NaN 3.0 2.0 2.0 893
8152 NaN 3.0 NaN 2.0 980
... ... ... ... ... ...
7541 2001.0 3.0 NaN 2.0 828
7927 NaN 3.0 NaN 2.0 750
5340 2023.0 4.0 2.0 2.0 1000
1369 NaN 1.0 NaN 1.0 473
3659 2017.0 3.0 NaN 2.0 953

7825 rows × 5 columns

Show Code
X_train_num.isna().sum()
completion_year    3438
rooms                 2
parking            2074
bathroom              0
size_sqft             0
dtype: int64
  • We can fill completion year, rooms, parking and bathroom with mode
Show Code
from sklearn.impute import SimpleImputer

def numericalImputation(X_train_num, strategy = 'most_frequent'):
    """
    Fungsi untuk melakukan imputasi data numerik NaN
    :param data: <pandas dataframe> sample data input

    :return X_train_numerical: <pandas dataframe> data numerik
    :return imputer_numerical: numerical imputer method
    """
    #buat imputer
    imputer_num = SimpleImputer(missing_values = np.nan, strategy = strategy)
    
    #fitting
    imputer_num.fit(X_train_num)

    # transform
    imputed_data = imputer_num.transform(X_train_num)
    X_train_num_imputed = pd.DataFrame(imputed_data)

    #pastikan index dan nama kolom antara imputed dan non-imputed SAMA
    X_train_num_imputed.columns = X_train_num.columns
    X_train_num_imputed.index = X_train_num.index

    return X_train_num_imputed, imputer_num
Show Code
X_train_num, imputer_num = numericalImputation(X_train_num, strategy='most_frequent')
X_train_num.isna().sum()
completion_year    0
rooms              0
parking            0
bathroom           0
size_sqft          0
dtype: int64
Show Code
imputer_num
SimpleImputer(strategy='most_frequent')
In a Jupyter environment, please rerun this cell to show the HTML representation or trust the notebook.
On GitHub, the HTML representation is unable to render, please try loading this page with nbviewer.org.

Categorical Data

Show Code
X_train_cat = X_train.select_dtypes(include='object')
X_train_cat
location property_type furnished nearby_railways
8649 Maju Condominium Fully Furnished yes
9112 Bangsar Condominium Fully Furnished yes
1472 Jalil Condominium Fully Furnished yes
5536 Cheras Condominium Fully Furnished no
8152 Pudu Apartment Partially Furnished yes
... ... ... ... ...
7541 Ampang Apartment Partially Furnished NaN
7927 South Flat Not Furnished NaN
5340 Cheras Condominium Partially Furnished yes
1369 KLCC Condominium Fully Furnished yes
3659 Road Service Residence Partially Furnished NaN

7825 rows × 4 columns

Show Code
X_train_cat.isna().sum()
location              0
property_type         0
furnished             0
nearby_railways    2206
dtype: int64
  • Impute with mode
Show Code
X_train_cat, imputer_num = numericalImputation(X_train_cat, strategy='most_frequent')
X_train_cat.isna().sum()
location           0
property_type      0
furnished          0
nearby_railways    0
dtype: int64

Preprocessing Categorical Variable

Show Code
X_train_cat_ohe =  pd.get_dummies(X_train_cat)
X_train_cat_ohe.head(2)
location_Ampang location_Bangsar location_Besi location_Bintang location_Brickfields location_Centre location_Cheras location_City location_Damansara location_Desa ... property_type_Duplex property_type_Flat property_type_Others property_type_Service Residence property_type_Studio furnished_Fully Furnished furnished_Not Furnished furnished_Partially Furnished nearby_railways_no nearby_railways_yes
8649 0 0 0 0 0 0 0 0 0 0 ... 0 0 0 0 0 1 0 0 0 1
9112 0 1 0 0 0 0 0 0 0 0 ... 0 0 0 0 0 1 0 0 0 1

2 rows × 58 columns

Show Code
ohe_columns = X_train_cat_ohe.columns
ohe_columns
Index(['location_Ampang', 'location_Bangsar', 'location_Besi',
       'location_Bintang', 'location_Brickfields', 'location_Centre',
       'location_Cheras', 'location_City', 'location_Damansara',
       'location_Desa', 'location_Dutamas', 'location_Gombak',
       'location_Hartamas', 'location_Heights', 'location_Hilir',
       'location_Indah', 'location_Ipoh', 'location_Ismail', 'location_Jalil',
       'location_Jaya', 'location_KLCC', 'location_Kepong', 'location_Keramat',
       'location_Kiara', 'location_Kuching', 'location_Lama', 'location_Maju',
       'location_Melawati', 'location_Menjalara', 'location_OUG',
       'location_Pandan', 'location_Pantai', 'location_ParkCity',
       'location_Perdana', 'location_Petaling', 'location_Puchong',
       'location_Pudu', 'location_Road', 'location_Segambut',
       'location_Selatan', 'location_Sentul', 'location_Seputeh',
       'location_Setapak', 'location_Setiawangsa', 'location_South',
       'location_Titiwangsa', 'property_type_Apartment',
       'property_type_Condominium', 'property_type_Duplex',
       'property_type_Flat', 'property_type_Others',
       'property_type_Service Residence', 'property_type_Studio',
       'furnished_Fully Furnished', 'furnished_Not Furnished',
       'furnished_Partially Furnished', 'nearby_railways_no',
       'nearby_railways_yes'],
      dtype='object')
Show Code
X_train_cat_ohe.isna().sum()
location_Ampang                    0
location_Bangsar                   0
location_Besi                      0
location_Bintang                   0
location_Brickfields               0
location_Centre                    0
location_Cheras                    0
location_City                      0
location_Damansara                 0
location_Desa                      0
location_Dutamas                   0
location_Gombak                    0
location_Hartamas                  0
location_Heights                   0
location_Hilir                     0
location_Indah                     0
location_Ipoh                      0
location_Ismail                    0
location_Jalil                     0
location_Jaya                      0
location_KLCC                      0
location_Kepong                    0
location_Keramat                   0
location_Kiara                     0
location_Kuching                   0
location_Lama                      0
location_Maju                      0
location_Melawati                  0
location_Menjalara                 0
location_OUG                       0
location_Pandan                    0
location_Pantai                    0
location_ParkCity                  0
location_Perdana                   0
location_Petaling                  0
location_Puchong                   0
location_Pudu                      0
location_Road                      0
location_Segambut                  0
location_Selatan                   0
location_Sentul                    0
location_Seputeh                   0
location_Setapak                   0
location_Setiawangsa               0
location_South                     0
location_Titiwangsa                0
property_type_Apartment            0
property_type_Condominium          0
property_type_Duplex               0
property_type_Flat                 0
property_type_Others               0
property_type_Service Residence    0
property_type_Studio               0
furnished_Fully Furnished          0
furnished_Not Furnished            0
furnished_Partially Furnished      0
nearby_railways_no                 0
nearby_railways_yes                0
dtype: int64
Show Code
X_train_num.isna().sum()
completion_year    0
rooms              0
parking            0
bathroom           0
size_sqft          0
dtype: int64

Penggabungan Numerical dan Categorical data

Show Code
X_train_concat = pd.concat([X_train_num,
                            X_train_cat_ohe],
                           axis = 1)
Show Code
X_train_concat.head(2)
completion_year rooms parking bathroom size_sqft location_Ampang location_Bangsar location_Besi location_Bintang location_Brickfields ... property_type_Duplex property_type_Flat property_type_Others property_type_Service Residence property_type_Studio furnished_Fully Furnished furnished_Not Furnished furnished_Partially Furnished nearby_railways_no nearby_railways_yes
8649 2021.0 2.0 1.0 1.0 800.0 0 0 0 0 0 ... 0 0 0 0 0 1 0 0 0 1
9112 1993.0 2.0 1.0 1.0 890.0 0 1 0 0 0 ... 0 0 0 0 0 1 0 0 0 1

2 rows × 63 columns

Show Code
#sanity check
X_train_concat.isnull().sum()
completion_year                  0
rooms                            0
parking                          0
bathroom                         0
size_sqft                        0
                                ..
furnished_Fully Furnished        0
furnished_Not Furnished          0
furnished_Partially Furnished    0
nearby_railways_no               0
nearby_railways_yes              0
Length: 63, dtype: int64

Standarisasi

Show Code
from sklearn.preprocessing import StandardScaler

# Buat fungsi
def standardizerData(data):
    """
    Fungsi untuk melakukan standarisasi data
    :param data: <pandas dataframe> sampel data
    :return standardized_data: <pandas dataframe> sampel data standard
    :return standardizer: method untuk standardisasi data
    """
    data_columns = data.columns  # agar nama kolom tidak hilang
    data_index = data.index  # agar index tidak hilang

    # buat (fit) standardizer
    standardizer = StandardScaler()
    standardizer.fit(data)

    # transform data
    standardized_data_raw = standardizer.transform(data)
    standardized_data = pd.DataFrame(standardized_data_raw)
    standardized_data.columns = data_columns
    standardized_data.index = data_index

    return standardized_data, standardizer
Show Code
X_train_clean, standardizer = standardizerData(data = X_train_concat)
Show Code
X_train_clean.head()
completion_year rooms parking bathroom size_sqft location_Ampang location_Bangsar location_Besi location_Bintang location_Brickfields ... property_type_Duplex property_type_Flat property_type_Others property_type_Service Residence property_type_Studio furnished_Fully Furnished furnished_Not Furnished furnished_Partially Furnished nearby_railways_no nearby_railways_yes
8649 0.541336 -0.971807 -0.542258 -1.813058 -0.530030 -0.189407 -0.068927 -0.137405 -0.102909 -0.048017 ... -0.050621 -0.167279 -0.049336 -0.60979 -0.053098 1.072803 -0.406146 -0.805454 -0.619460 0.619460
9112 -3.913712 -0.971807 -0.542258 -1.813058 -0.190258 -0.189407 14.508152 -0.137405 -0.102909 -0.048017 ... -0.050621 -0.167279 -0.049336 -0.60979 -0.053098 1.072803 -0.406146 -0.805454 -0.619460 0.619460
1472 0.541336 -2.288585 -0.542258 -1.813058 0.980069 -0.189407 -0.068927 -0.137405 -0.102909 -0.048017 ... -0.050621 -0.167279 -0.049336 -0.60979 -0.053098 1.072803 -0.406146 -0.805454 -0.619460 0.619460
5536 0.541336 0.344970 1.685126 0.150837 -0.178932 -0.189407 -0.068927 -0.137405 -0.102909 -0.048017 ... -0.050621 -0.167279 -0.049336 -0.60979 -0.053098 1.072803 -0.406146 -0.805454 1.614308 -1.614308
8152 0.541336 0.344970 -0.542258 0.150837 0.149515 -0.189407 -0.068927 -0.137405 -0.102909 -0.048017 ... -0.050621 -0.167279 -0.049336 -0.60979 -0.053098 -0.932137 -0.406146 1.241535 -0.619460 0.619460

5 rows × 63 columns

Training Machine Learning

Since this is a regression model, R2 score and mean absolute error (MAE) will be used as a performance metrics.

The machine learning model will use baseline from average value of the target columns (monthly rent) and also result from linear regression model. After that, author used some of the recommended model based on previous works, which are random forest and gradient boosting to better improve the performance of the model.

Baseline-Average Value

The concept here is to use average value of the target as the easiest way to predict the monhtly rent of a unit.

Show Code
y_baseline = np.ones(len(y_train)) * y_train.mean()
y_baseline
array([1780.0086901, 1780.0086901, 1780.0086901, ..., 1780.0086901,
       1780.0086901, 1780.0086901])
Show Code
from sklearn.linear_model import LinearRegression
from sklearn.metrics import mean_squared_error, r2_score, mean_absolute_error

# Train the linear regression model
lin_reg = LinearRegression().fit(X_train_clean, y_train)

# Predict using the train data
y_pred_train = y_baseline

# Calculate R-squared
r2_baseline = r2_score(y_train, y_pred_train)

#calculate MAE
mae_baseline = mean_absolute_error(y_train, y_pred_train)

print(f"R2-score: {r2_baseline:.4f} and MAE score: {mae_baseline:.4f}")
R2-score: 0.0000 and MAE score: 562.3710
Show Code
plt.scatter(x=y_train, y=y_pred_train);

Baseline-Linear Regression

The second method is using linear regression, which simply put is finding the minum total error (distance) between predicted value and the target value, using linear equation.

Show Code
from sklearn.linear_model import LinearRegression
from sklearn.metrics import mean_squared_error, r2_score

# Train the linear regression model
lin_reg = LinearRegression().fit(X_train_clean, y_train)

# Predict using the train data
# y_pred = y_baseline
y_pred_train = lin_reg.predict(X_train_clean)

# Calculate mean absolute error
mae_linreg = mean_absolute_error(y_train, y_pred_train)

# Calculate R-squared
r2_linreg = r2_score(y_train, y_pred_train)

print(f"R2-score: {r2_linreg:.4f} and MAE score: {mae_linreg:.4f}")
R2-score: 0.6468 and MAE score: 319.2229
Show Code
sns.jointplot(x=y_train, y=y_pred_train);

GradientBoosting

The gradient boosting, is one of the recommendation from previous works, is a model where each sample would be given a different weights (boosts) depending on its performance in predicting the value/ target.

Show Code
from sklearn.ensemble import GradientBoostingRegressor
# Build random forest
grad_tree = GradientBoostingRegressor(random_state = 123)
Show Code
# Fit random forest
grad_tree.fit(X_train_clean, y_train)
GradientBoostingRegressor(random_state=123)
In a Jupyter environment, please rerun this cell to show the HTML representation or trust the notebook.
On GitHub, the HTML representation is unable to render, please try loading this page with nbviewer.org.
Show Code
# Predict
y_pred_train = grad_tree.predict(X_train_clean)
# y_pred_test = grad_tree.predict(X_test_clean)

# Calculate mean absolute error
mae_gb = mean_absolute_error(y_train, y_pred_train)

# Calculate R-squared
r2_gb = r2_score(y_train, y_pred_train)

print(f"R2-score: {r2_gb:.4f} and MAE score: {mae_gb:.4f}")
R2-score: 0.7246 and MAE score: 281.6835
Show Code
sns.jointplot(x=y_train, y=y_pred_train);

Show Code
#gridsearch

from sklearn.model_selection import GridSearchCV 


params = {'n_estimators': [100, 200, 300, 400, 500],
              'learning_rate': [0.1, 0.05, 0.01]}

# Buat gridsearch
grad_tree = GradientBoostingRegressor(random_state = 123)

grad_tree_cv = GridSearchCV(estimator = grad_tree,
                           param_grid = params,
                           cv = 5,
                           scoring = "neg_mean_absolute_error")
Show Code
# Fit grid search cv
grad_tree_cv.fit(X_train_clean, y_train)
GridSearchCV(cv=5, estimator=GradientBoostingRegressor(random_state=123),
             param_grid={'learning_rate': [0.1, 0.05, 0.01],
                         'n_estimators': [100, 200, 300, 400, 500]},
             scoring='neg_mean_absolute_error')
In a Jupyter environment, please rerun this cell to show the HTML representation or trust the notebook.
On GitHub, the HTML representation is unable to render, please try loading this page with nbviewer.org.
Show Code
# Best params
grad_tree_cv.best_params_
{'learning_rate': 0.1, 'n_estimators': 500}
Show Code
# Refit the Adaboost
grad_tree = GradientBoostingRegressor(n_estimators = grad_tree_cv.best_params_["n_estimators"],
                                      random_state = 123)

grad_tree.fit(X_train_clean, y_train)
GradientBoostingRegressor(n_estimators=500, random_state=123)
In a Jupyter environment, please rerun this cell to show the HTML representation or trust the notebook.
On GitHub, the HTML representation is unable to render, please try loading this page with nbviewer.org.
Show Code
# Predict
y_pred_train = grad_tree.predict(X_train_clean)

# Calculate mean absolute error
mae_gb_cv = mean_absolute_error(y_train, y_pred_train)

# Calculate R-squared
r2_gb_cv = r2_score(y_train, y_pred_train)

print(f"R2-score: {r2_gb_cv:.4f} and MAE score: {mae_gb_cv:.4f}")
R2-score: 0.8194 and MAE score: 228.0225
Show Code
sns.jointplot(x=y_train, y=y_pred_train);

Random Forest

The last model, which was also recommended by previous works, is a model where not only it has weights based on its performance, but the feature selection in which the sample is measured was done at random. Therefore, reduces not only the variance, but also the bias.

Show Code
from sklearn.ensemble import RandomForestRegressor
Show Code
# Build random forest
rf_tree = RandomForestRegressor(n_estimators = 100,
                                criterion = "squared_error",
                                max_features = "sqrt",
                                random_state = 123)
Show Code
# Fit random forest
rf_tree.fit(X_train_clean, y_train)
RandomForestRegressor(max_features='sqrt', random_state=123)
In a Jupyter environment, please rerun this cell to show the HTML representation or trust the notebook.
On GitHub, the HTML representation is unable to render, please try loading this page with nbviewer.org.
Show Code
# Predict
y_pred_train = rf_tree.predict(X_train_clean)

# Calculate mean absolute error
mae_rf = mean_absolute_error(y_train, y_pred_train)

# Calculate R-squared
r2_rf = r2_score(y_train, y_pred_train)

print(f"R2-score: {r2_rf:.4f} and MAE score: {mae_rf:.4f}")
R2-score: 0.9577 and MAE score: 100.8408
Show Code
sns.jointplot(x=y_train, y=y_pred_train);

Show Code
params = {"n_estimators": [100, 200, 300, 500 ],
          "max_features": ["sqrt", "log2"]}

# Buat gridsearch
rf_tree = RandomForestRegressor(criterion = "squared_error",
                                random_state = 123)

rf_tree_cv = GridSearchCV(estimator = rf_tree,
                          param_grid = params,
                          cv = 5,
                          scoring = "neg_mean_absolute_error")
Show Code
# Fit grid search cv
rf_tree_cv.fit(X_train_clean, y_train)
GridSearchCV(cv=5, estimator=RandomForestRegressor(random_state=123),
             param_grid={'max_features': ['sqrt', 'log2'],
                         'n_estimators': [100, 200, 300, 500]},
             scoring='neg_mean_absolute_error')
In a Jupyter environment, please rerun this cell to show the HTML representation or trust the notebook.
On GitHub, the HTML representation is unable to render, please try loading this page with nbviewer.org.
Show Code
# Best params
rf_tree_cv.best_params_
{'max_features': 'sqrt', 'n_estimators': 500}
Show Code
# Refit the Random Forest
rf_tree = RandomForestRegressor(criterion = "squared_error",
                                max_features = rf_tree_cv.best_params_["max_features"],
                                n_estimators = rf_tree_cv.best_params_["n_estimators"],
                                random_state = 123)

rf_tree.fit(X_train_clean, y_train)
RandomForestRegressor(max_features='sqrt', n_estimators=500, random_state=123)
In a Jupyter environment, please rerun this cell to show the HTML representation or trust the notebook.
On GitHub, the HTML representation is unable to render, please try loading this page with nbviewer.org.
Show Code
# Predict
y_pred_train = rf_tree.predict(X_train_clean)

# Calculate mean absolute error
mae_rf_cv = mean_absolute_error(y_train, y_pred_train)

# # Calculate R-squared
r2_rf_cv = r2_score(y_train, y_pred_train)

print(f"R2-score: {r2_rf_cv:.4f} and MAE score: {mae_rf_cv:.4f}")
R2-score: 0.9585 and MAE score: 99.7989
Show Code
sns.jointplot(x=y_train, y=y_pred_train);

Show Code
mae_score = [mae_baseline, mae_linreg, mae_gb, mae_gb_cv, mae_rf, mae_rf_cv]
r2_score = [r2_baseline, r2_linreg, r2_gb, r2_gb_cv, r2_rf, r2_rf_cv]
indexes = ["baseline", "linear regression", "gradient boosting", "gradient boosting with CV", "random forest",  "random forest with CV"]

summary_df = pd.DataFrame({
    "MAE Train": mae_score,
    "R2-Score": r2_score,
},index = indexes)

summary_df.sort_values(by='R2-Score', ascending=False)
MAE Train R2-Score
random forest with CV 99.798879 0.958519
random forest 100.840759 0.957661
gradient boosting with CV 228.022510 0.819416
gradient boosting 281.683477 0.724601
linear regression 319.222873 0.646780
baseline 562.370983 0.000000

From the above table, it can be seen that Random Forest model performs the best, and Gradient Boosting at the second place. This is similar to the previous work done by others, on house pricing.

Best Model

Show Code
# libraries
from sklearn.ensemble import RandomForestRegressor
from sklearn.metrics import mean_squared_error, r2_score


#setting up
rf_tree = RandomForestRegressor(n_estimators = 500,
                                criterion = "squared_error",
                                max_features = "sqrt",
                                random_state = 123)

#fit model train
rf_tree.fit(X_train_clean, y_train)

# Predict model train
y_pred_train = rf_tree.predict(X_train_clean)

# Calculate mean absolute error
mae_rf_cv_train = mean_absolute_error(y_train, y_pred_train)

# # Calculate R-squared
r2_rf_cv_train = r2_score(y_train, y_pred_train)

print(f"R2-score: {r2_rf_cv_train:.3f} and MAE score: +/-{mae_rf_cv_train:.2f} RM")

sns.scatterplot(x=y_train, y=y_pred_train )
plt.plot([0, 5500], [0,5500], "--r")
plt.xlim(0, 5500)
plt.xlabel("Actual Monthly Rent")
plt.ylim(0,5500)
plt.ylabel("Predicted Monthly Rent")
plt.suptitle("Random Forest - Best Regression Model")
plt.show()
R2-score: 0.959 and MAE score: +/-99.80 RM

Data Prediction

Test Data Preprocessing

Simlar process done in train dataset need to be repeated on test dataset.

Show Code
#checking null data
X_test.isna().sum()
completion_year    834
location             0
property_type        0
rooms                0
parking            506
bathroom             0
size_sqft            0
furnished            0
nearby_railways    552
dtype: int64

Numerical Data

Show Code
X_test_num =  X_test.select_dtypes(exclude='object')
X_test_num
completion_year rooms parking bathroom size_sqft
324 NaN 3.0 NaN 2.0 1097
7209 2011.0 4.0 2.0 3.0 1200
1863 NaN 2.0 NaN 1.0 560
2443 2021.0 3.0 1.0 2.0 1200
9218 2023.0 1.0 2.0 2.0 300
... ... ... ... ... ...
7510 2008.0 3.0 1.0 2.0 1204
928 2013.0 1.0 NaN 1.0 350
2181 2019.0 1.0 1.0 1.0 653
4065 NaN 2.0 NaN 2.0 600
9041 2021.0 3.0 NaN 2.0 800

1957 rows × 5 columns

Show Code
X_test_num.isna().sum()
completion_year    834
rooms                0
parking            506
bathroom             0
size_sqft            0
dtype: int64
Show Code
X_test_num, imputer_num = numericalImputation(X_test_num, strategy='most_frequent')
X_test_num.isna().sum()
completion_year    0
rooms              0
parking            0
bathroom           0
size_sqft          0
dtype: int64

Categorical Data

Show Code
X_test_cat = X_test.select_dtypes(include='object')
X_test_cat
location property_type furnished nearby_railways
324 South Condominium Partially Furnished no
7209 KLCC Condominium Fully Furnished NaN
1863 Maju Flat Not Furnished NaN
2443 Lama Condominium Fully Furnished yes
9218 Cheras Condominium Fully Furnished yes
... ... ... ... ...
7510 Setiawangsa Condominium Fully Furnished yes
928 Road Condominium Fully Furnished NaN
2181 Segambut Service Residence Fully Furnished no
4065 Lama Apartment Not Furnished no
9041 Setapak Condominium Partially Furnished yes

1957 rows × 4 columns

Show Code
X_test_cat.isna().sum()
location             0
property_type        0
furnished            0
nearby_railways    552
dtype: int64
Show Code
X_test_cat, imputer_num = numericalImputation(X_test_cat, strategy='most_frequent')
X_test_cat.isna().sum()
location           0
property_type      0
furnished          0
nearby_railways    0
dtype: int64

Categorical OHE

Show Code
X_test_cat_ohe =  pd.get_dummies(X_test_cat)
X_test_cat_ohe.head(2)
location_Ampang location_Bangsar location_Besi location_Bintang location_Brickfields location_Centre location_Cheras location_City location_Damansara location_Desa ... property_type_Duplex property_type_Flat property_type_Others property_type_Service Residence property_type_Studio furnished_Fully Furnished furnished_Not Furnished furnished_Partially Furnished nearby_railways_no nearby_railways_yes
324 0 0 0 0 0 0 0 0 0 0 ... 0 0 0 0 0 0 0 1 1 0
7209 0 0 0 0 0 0 0 0 0 0 ... 0 0 0 0 0 1 0 0 0 1

2 rows × 58 columns

Show Code
ohe_columns = X_test_cat_ohe.columns
ohe_columns
Index(['location_Ampang', 'location_Bangsar', 'location_Besi',
       'location_Bintang', 'location_Brickfields', 'location_Centre',
       'location_Cheras', 'location_City', 'location_Damansara',
       'location_Desa', 'location_Dutamas', 'location_Gombak',
       'location_Hartamas', 'location_Heights', 'location_Hilir',
       'location_Indah', 'location_Ipoh', 'location_Ismail', 'location_Jalil',
       'location_Jaya', 'location_KLCC', 'location_Kepong', 'location_Keramat',
       'location_Kiara', 'location_Kuching', 'location_Lama', 'location_Maju',
       'location_Melawati', 'location_Menjalara', 'location_OUG',
       'location_Pandan', 'location_Pantai', 'location_ParkCity',
       'location_Perdana', 'location_Petaling', 'location_Puchong',
       'location_Pudu', 'location_Road', 'location_Segambut',
       'location_Selatan', 'location_Sentul', 'location_Seputeh',
       'location_Setapak', 'location_Setiawangsa', 'location_South',
       'location_Titiwangsa', 'property_type_Apartment',
       'property_type_Condominium', 'property_type_Duplex',
       'property_type_Flat', 'property_type_Others',
       'property_type_Service Residence', 'property_type_Studio',
       'furnished_Fully Furnished', 'furnished_Not Furnished',
       'furnished_Partially Furnished', 'nearby_railways_no',
       'nearby_railways_yes'],
      dtype='object')

Penggabungan Numerical dan Categorical data

Show Code
X_test_concat = pd.concat([X_test_num,
                            X_test_cat_ohe],
                           axis = 1)
Show Code
X_test_concat.head(2)
completion_year rooms parking bathroom size_sqft location_Ampang location_Bangsar location_Besi location_Bintang location_Brickfields ... property_type_Duplex property_type_Flat property_type_Others property_type_Service Residence property_type_Studio furnished_Fully Furnished furnished_Not Furnished furnished_Partially Furnished nearby_railways_no nearby_railways_yes
324 2021.0 3.0 1.0 2.0 1097.0 0 0 0 0 0 ... 0 0 0 0 0 0 0 1 1 0
7209 2011.0 4.0 2.0 3.0 1200.0 0 0 0 0 0 ... 0 0 0 0 0 1 0 0 0 1

2 rows × 63 columns

Show Code
#sanity check
X_test_concat.isnull().sum()
completion_year                  0
rooms                            0
parking                          0
bathroom                         0
size_sqft                        0
                                ..
furnished_Fully Furnished        0
furnished_Not Furnished          0
furnished_Partially Furnished    0
nearby_railways_no               0
nearby_railways_yes              0
Length: 63, dtype: int64

Standarisasi

Show Code
from sklearn.preprocessing import StandardScaler

# Buat fungsi
def standardizerData(data):
    """
    Fungsi untuk melakukan standarisasi data
    :param data: <pandas dataframe> sampel data
    :return standardized_data: <pandas dataframe> sampel data standard
    :return standardizer: method untuk standardisasi data
    """
    data_columns = data.columns  # agar nama kolom tidak hilang
    data_index = data.index  # agar index tidak hilang

    # buat (fit) standardizer
    standardizer = StandardScaler()
    standardizer.fit(data)

    # transform data
    standardized_data_raw = standardizer.transform(data)
    standardized_data = pd.DataFrame(standardized_data_raw)
    standardized_data.columns = data_columns
    standardized_data.index = data_index

    return standardized_data, standardizer
Show Code
X_test_clean, standardizer = standardizerData(data = X_test_concat)
Show Code
X_test_clean.head()
completion_year rooms parking bathroom size_sqft location_Ampang location_Bangsar location_Besi location_Bintang location_Brickfields ... property_type_Duplex property_type_Flat property_type_Others property_type_Service Residence property_type_Studio furnished_Fully Furnished furnished_Not Furnished furnished_Partially Furnished nearby_railways_no nearby_railways_yes
324 0.552642 0.320875 -0.541910 0.124936 0.555078 -0.168453 -0.071667 -0.120479 -0.09361 -0.055456 ... -0.059914 -0.161923 -0.059914 -0.60234 -0.045256 -0.949656 -0.368524 1.208981 1.563785 -1.563785
7209 -0.958283 1.620985 1.505421 2.112746 0.933643 -0.168453 -0.071667 -0.120479 -0.09361 -0.055456 ... -0.059914 -0.161923 -0.059914 -0.60234 -0.045256 1.053013 -0.368524 -0.827143 -0.639474 0.639474
1863 0.552642 -0.979234 -0.541910 -1.862873 -1.418602 -0.168453 -0.071667 -0.120479 -0.09361 -0.055456 ... -0.059914 6.175759 -0.059914 -0.60234 -0.045256 -0.949656 2.713531 -0.827143 -0.639474 0.639474
2443 0.552642 0.320875 -0.541910 0.124936 0.933643 -0.168453 -0.071667 -0.120479 -0.09361 -0.055456 ... -0.059914 -0.161923 -0.059914 -0.60234 -0.045256 1.053013 -0.368524 -0.827143 -0.639474 0.639474
9218 0.854826 -2.279344 1.505421 0.124936 -2.374201 -0.168453 -0.071667 -0.120479 -0.09361 -0.055456 ... -0.059914 -0.161923 -0.059914 -0.60234 -0.045256 1.053013 -0.368524 -0.827143 -0.639474 0.639474

5 rows × 63 columns

Test Data Result

Show Code
# libraries
from sklearn.ensemble import RandomForestRegressor
from sklearn.metrics import mean_squared_error, r2_score


#setting up
rf_tree = RandomForestRegressor(n_estimators = 500,
                                criterion = "squared_error",
                                max_features = "sqrt",
                                random_state = 123)

#fit model train
rf_tree.fit(X_train_clean, y_train)

# Predict model
y_pred_test = rf_tree.predict(X_test_clean)

# Calculate mean absolute error
mae_rf_cv_test = mean_absolute_error(y_test, y_pred_test)

# # Calculate R-squared
r2_rf_cv_test = r2_score(y_test, y_pred_test)

print(f"R2-score: {r2_rf_cv_test:.3f} and MAE score: +/-{mae_rf_cv_test:.2f} RM")

sns.scatterplot(x=y_test, y=y_pred_test )
plt.plot([0, 5500], [0,5500], "--r")
plt.xlim(0, 5500)
plt.xlabel("Actual Monthly Rent")
plt.ylim(0,5500)
plt.ylabel("Predicted Monthly Rent")
plt.suptitle("Random Forest - Best Regression Model")
plt.show()
R2-score: 0.803 and MAE score: +/-214.08 RM

Show Code
mae_score = [mae_rf_cv_train, mae_rf_cv_test]
r2_score = [r2_rf_cv_train, r2_rf_cv_test]
indexes = ["train", "test"]

summary_df_train_test = pd.DataFrame({
    "MAE Train": mae_score,
    "R2-Score": r2_score,
},index = indexes)

summary_df_train_test
MAE Train R2-Score
train 99.798879 0.958519
test 214.084111 0.802556

Feature Importance

Show Code
# calculate the feature importances
importances = rf_tree.feature_importances_

# rescale the importances back to the original scale of the features
importances = importances * X_train_clean.std()

# sort the feature importances in descending order
sorted_index = importances.argsort()[::-1]

# print the feature importances
dict_feature_importance = {}
for i in sorted_index:
    # print("{}: {}".format(X_train_clean.columns[i], importances[i]))
    dict_feature_importance.update({X_train_clean.columns[i]: importances[i]})
    
# Create a DataFrame from the dictionary
df = pd.DataFrame.from_dict(dict_feature_importance, orient='index', columns=['values'])

# Reset the index to become a column
df = df.reset_index()

# Rename the columns
df.columns = ['feature', 'importance_value']

df.sort_values(by='importance_value', ascending=False).head(10)
feature importance_value
0 size_sqft 0.227595
1 furnished_Fully Furnished 0.106722
2 completion_year 0.073598
3 bathroom 0.059699
4 rooms 0.046285
5 parking 0.045606
6 location_Kiara 0.042962
7 furnished_Not Furnished 0.040320
8 location_KLCC 0.037287
9 furnished_Partially Furnished 0.036137

Results

  1. Result indicates that the best model for prediction is Random Forest with hyperparameter tuning, scoring 95% on R2-score, and a shy 100 RM on MAE. This proves to be a good model since the test dataset gives a scoring of 80% on R2, and 240 RM on MAE.

  2. There are some factors that author believed to be affecting the result/ performance of the model:

    1. Dropping missing value reduces the performance! Initial model uses half of the data (4-5k rows) and gives poorer performance on R2 and MAE. Imputation and keeping the number of rows close to the original dataset (9k rows) proves to be improving the model. Especially on test dataset.
    2. Feature selection importance can be seen on the last table, but initially the selection was based on paper and intuition of the author (author lives and work in KL, Malaysia for 5 years). Feature such as completion_year and nearby_railways are important in improving the model.
    3. Last but not least is the outlier identification. The best practice for me is using jointplot to see not only the distribution of the data in 2-dimension, but also in the third dimension (the density) of the data.
  3. Some of the feature that were believed to be quite important even before doing the modeling is size, furnished and location. All three is available within the 10-most features affecting the modeling. As a context, location in KLCC is like Pondok Indah in South Jakarta. Location in Kiara is like BSD in South Tangerang.

Discussions

  1. One of the feature that author thinks is significant but not appearing on the 10-best important feature is nearby_railways. This column is showing if a certain property has a close proximity to a railways (KTM/LRT). The issue is, half of the data is missing, hence the imputation. Author belives, the proximity to nearby railways line can be approximated using manhanttan distance of railways line to each property unit.

References

Madhuri, CH. Raga, G. Anuradha, and M. Vani Pujitha. 2019. “House Price Prediction Using Regression Techniques: A Comparative Study.” 2019 International Conference on Smart Structures and Systems (ICSSS), March. https://doi.org/10.1109/icsss.2019.8882834.
Xu, Kevin, and Hieu Nguyen. 2022. “Predicting Housing Prices and Analyzing Real Estate Market in the Chicago Suburbs Using Machine Learning.” https://doi.org/10.48550/ARXIV.2210.06261.
Zhao, Yaping, Ramgopal Ravi, Shuhui Shi, Zhongrui Wang, Edmund Y. Lam, and Jichang Zhao. 2022. “PATE: Property, Amenities, Traffic and Emotions Coming Together for Real Estate Price Prediction.” https://doi.org/10.48550/ARXIV.2209.05471.

Citation

BibTeX citation:
@online{arie wijaya2023,
  author = {Arie Wijaya, Aditya},
  title = {{Malaysia} {Property} {Pricing} - {Webscraping} \& {Machine}
    {Learning} {Model}},
  date = {2023-02-10},
  url = {https://adtarie.net/posts/005-webscraping-machinelearning-rent-pricing},
  langid = {en}
}
For attribution, please cite this work as:
Arie Wijaya, Aditya. 2023.“ Malaysia Property Pricing - Webscraping & Machine Learning Model.” February 10, 2023. https://adtarie.net/posts/005-webscraping-machinelearning-rent-pricing.